
Introducing My Stuff+ Model
Using velocity, spin, and movement characteristics to measure pitch effectiveness.


Over the past couple of seasons, pitch modeling has become a prominent element of analyzing a pitcher’s performance as well as evaluating the effectiveness of the pitches in a pitcher’s arsenal. Statistics such as Stuff+ (created by Max Bay and Eno Sarris) and PitchingBot (created by Cameron Grove) have been two of the most prominent pitch models available to the public over the past couple of seasons, while various other analysts have also created similar models to evaluate pitching performance.
Pitch models, like Stuff+ in particular, evaluate each pitch solely based on the velocity, spin rate, and movement characteristics of the pitch. Additional variables are also added to the model, such as release point and spin axis, in order to improve the model’s effectiveness. Utilizing Stuff+ is important in two ways. First off, by knowing what combination of velocity, spin, and movement are effective based on pitch type, pitchers are able to better design their pitches to maximize their effectiveness, eliminating some of the guesswork that was needed in pitching development in the past. Another reason for utilizing Stuff+ is that the best models can be used to predict the current and future performance of pitchers better than conventional metrics (ERA, FIP, K-BB%, etc.) are at predicting themselves.
I have been fascinated by pitch modeling ever since I first heard about the concept during the 2022 season. That November, I embarked on a mission to create my own pitch model by utilizing a linear regression to predict pitcher performance. This would be quite discouraging, as relationships between pitch characteristics are much more complex than what can be captured by simple linear regression, and led me to learn about XGBoost. Most pitch quality models are created using XGBoost, as the algorithm is able to capture complex patterns in data through its use of gradient boosting techniques. XGBoost is able to efficiently process large datasets and handles various types of features, making it exceptionally suited for pitch quality modeling where numerous variables influence outcomes.
After becoming familiar with XGBoost, I worked on my pitch quality model a few times and this month I finally constructed a model that I am confident to release to the public. This article will detail the process I undertook and reveal the results from the first version of my Stuff+ model.
Methodology:
As with most pitch quality models, my version of Stuff+ is trained to predict the expected run value of each pitch. In order to create a target variable to predict the expected run value of each pitch, I calculated the average run expectancy of each average and count and applied these values to their respective outcomes. For example, each 1-2 swinging strike will have the same expected run value using this method. To account for platoon splits, I also grouped each outcome by pitcher and batter handedness. I believe that this is an essential adjustment to make as the performance of certain pitches can depend on the handedness of the hitter (ex. Sweepers perform better to same-handedness hitters, Changeups perform better to hitters of the opposite handedness).
I decided to train my model on all pitches thrown during the 2021, 2022, and 2023 Major League Baseball seasons. Some models that I am aware of are trained on datasets that are bigger and/or span more seasons, but I believe that containing the model training to the past three seasons is the most effective way to construct a pitch quality model. League trends change fast in Major League Baseball (with the rise of the Sweeper over the past two seasons being a prominent example), and I believe that utilizing a smaller sample size can more effectively capture these trends. While it is very difficult to identify who has used “sticky stuff” or other foreign substances in the past to improve their performance, restricting the training sample to the past three seasons also lowers the amount of data in the model that is from the pre-enforcement era.
To predict the expected run value of each pitch, I used the following variables as predictors: velocity (MPH), induced vertical break, horizontal movement, spin rate (RPM), spin axis, release extension, vertical release point, and horizontal release point. Similar to the FanGraphs Stuff+ model, I also calculated the velocity, vertical movement, and horizontal movement differences from each pitcher’s primary Fastball (Four-Seam Fastball, Sinker, or primary Cutter) and included these metrics as predictors as well. It is important to include variables that measure differences from a pitcher’s Fastball as most hitters tend to calibrate their timing to the velocity of the opposing pitcher’s primary Fastball. Accounting for this allows for the model to better understand what makes a secondary pitch effective, independent of their isolated velocity and movement characteristics. In order to improve the accuracy of the model, I also adjusted horizontal movement, horizontal release point, and spin axis by pitcher handedness. I believe that this adjustment is necessary since left and right-handed pitchers release their pitches from different locations on the mound and their pitches spin in opposite directions.
As mentioned earlier, I trained the model using an XGBoost regression model. To improve the accuracy of the model, I improved the model’s hyperparameters using the Hyperopt package in Python. I decided to run one model including all pitch types rather than the bucketing approach (running separate Fastball, Breaking Ball, and Off-Speed models) that some other pitch quality models follow, and I believe that this method is more appropriate for this analysis because it allows for each pitch’s effectiveness to be compared to all other pitches, rather than just pitches within their classification. With that being said, onto the model performance!
Feature Importance:

The table above displays the feature importance of all of the variables in the XGBoost regression model. As is the case with most pitch quality models, velocity is the most important feature in my Stuff+ model, with spin rate and induced vertical break also being variables of significant importance.
The most intriguing result of this analysis was the importance that the horizontal and vertical release point of each pitch has on the model, with adjusted horizontal release point being the second most important feature in my Stuff+ model. At first, I was confused by this result as I expected the actual velocity and movement characteristics of each pitch to be the most important variables since these variables are what is traditionally referred to as “stuff”. Upon deeper thought, the heightened importance of release point in my model is an important piece of my model as it can serve as a proxy measure of deception.
In general, a pitcher that has an over-the-top arm slot is more likely to have a north-south arsenal (Four-Seam Fastball with plus induced vertical break, bullet/gyro Slider or Cutter, 12-6 Curveball), while a pitcher with a sidearm arm slot is more likely to have an east-west arsenal (Sinker, Sweeper). If a pitcher with an over-the-top arm slot is able to throw a Sweeper, or if a pitcher with a side-arm arm slot is able to throw a Four Seamer with plus induced vertical break, then these pitches will be considered valuable since they possess movement profiles that would not be anticipated by the hitter based on their arm slot and release points. Using this logic, a Four-Seamer thrown with 17 inches of induced vertical break by a pitcher with a three-quarters arm slot should be graded higher than a Four-Seamer thrown with 17 inches of induced vertical break by a pitcher with an over-the-top arm slot. Given the high amount of importance placed on horizontal and vertical release point, my Stuff+ model is able to effectively capture this deceptive effect, improving the predictive performance of the model.
Descriptive + Predictive Performance:
Creating a model whose results make intuitive sense is only one step of the equation. Ensuring that the model is able to predict future performance, as well as describe the current performance of a pitcher and their arsenal is the real value of creating a pitch quality model like Stuff+. To measure the descriptive and predictive abilities of my pitch quality model (which will be referred to from this point forward as aStuff+), I will evaluate the correlations of aStuff+, FanGraphs Stuff+, FIP, and K-BB% with ERA, FIP, and K-BB%. I will construct four separate tables for each analysis, grouped by minimum pitches thrown (100, 250, 500, and 750). For the descriptive analysis, I will compare Y1 data to itself, while I will compare Y1 data to Y2 for the predictive analysis.

aStuff+ is primarily meant to be a predictive statistic, but it is important to also evaluate the descriptive qualities of the statistic in order to evaluate all of the possible ways that the statistics can be utilized. As shown by the table above, aStuff+ outperforms FanGraphs Stuff+ when it comes to predicting a pitcher’s ERA, FIP, and K-BB% in a given season with both small and large sample sizes. Despite this, aStuff+ is not better than FIP or K-BB% at predicting ERA, or K-BB% at predicting FIP within a given season in both small and large sample sizes.

In small and large sample sizes, aStuff+ is an effective statistic to utilize as a predictive measure of a pitcher’s performance. As shown by the tables above, aStuff+ is better at predicting next season’s FIP than FIP itself in both small and large sample sizes and is better at predicting next season’s FIP than K-BB% in large sample sizes (K-BB% correlates better in small sample sizes). aStuff+ outperforms FanGraphs Stuff+ in large sample sizes, while FanGraphs Stuff+ outperforms aStuff+ in small sample sizes.
Stickiness + Stabilization:
As a predictive statistic, it is important that aStuff+ is able to be “sticky” and have the ability to predict itself year-over-year. To calculate the stickiness of aStuff+, I conducted a simple linear regression of year-to-year aStuff+ to evaluate how much variance in Y2 aStuff+ can be explained by Y1 aStuff+. Similar to the descriptive/predictive analysis, I ran four separate regressions, grouped by minimum pitches thrown (100, 250, 500, and 750).
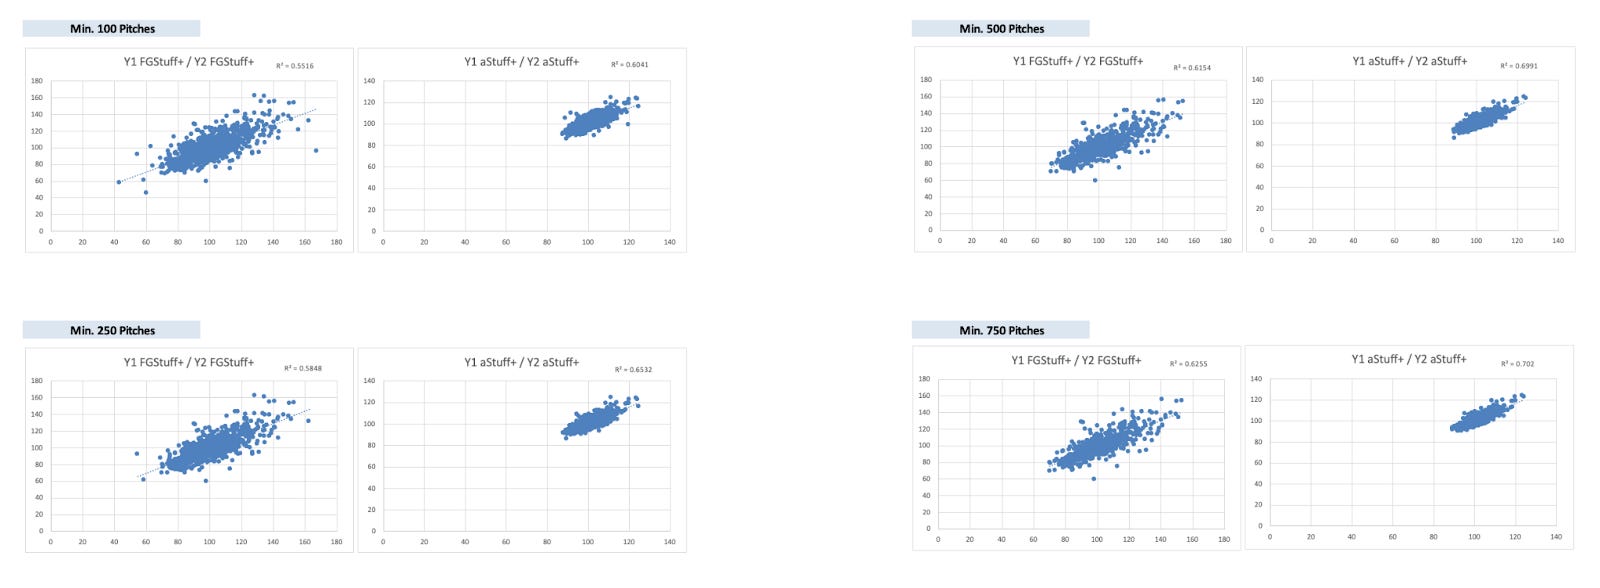
As shown by the tables above, aStuff+ is incredibly sticky from year-to-year, with an r-squared of at least .6041 depending on the minimum sample size. aStuff+ is more sticky in larger sample sizes, with an r-squared of .702 among pitchers with a minimum of 750 pitches thrown in consecutive seasons.
It is also important to analyze when aStuff+ stabilizes, as this provides insight into when it can be useful to utilize the statistic without concern of having an insufficient sample size. There are multiple methods in which the stabilization of a machine learning model like aStuff+ can be calculated. FanGraphs Stuff+ uses Cronenbach’s Alpha to identify the stabilization point of Stuff+, however, I am not familiar with how to complete this analysis. Instead, I took direct inspiration from Thomas Nestico’s tjStuff+ model and determined the stabilization point by identifying when a pitcher’s aStuff+ does not deviate by more than +- 0.5 aStuff+ over every 10 pitches, starting with 10 pitches (for more detail regarding Thomas’s method for calculating stabilization, please click on this link). In addition to calculating the stabilization over a pitcher’s entire arsenal, I also calculated the stabilization point for each pitch type.


As shown by the table above, the median stabilization point for aStuff+ is 72 pitches, which is less than one start for starting pitchers and no more than a handful of outings for relief pitchers. On the individual pitch type level, Sliders stabilize the fastest at 31 pitches while Slurves stabilize the slowest at 61 pitches. Four-Seam Fastballs stabilize at 58 pitches.
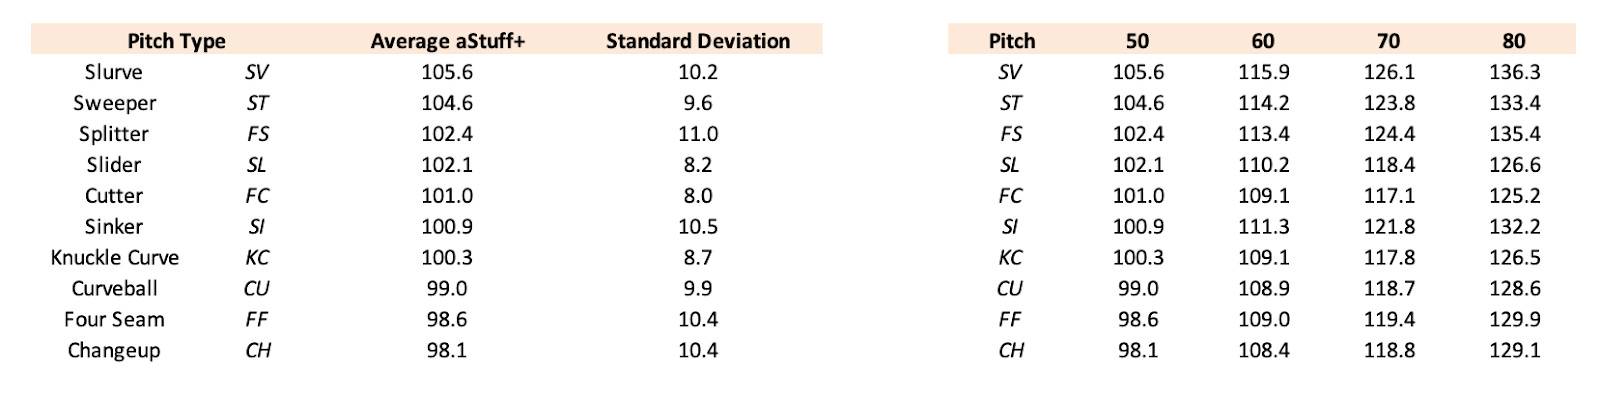
aStuff+ Leaderboards:
Now that we have established all the factors that go into aStuff+, it is time to analyze how well each pitcher and their pitch arsenals perform. It should be noted that aStuff+ is scaled so that a league average pitch is graded as 100 and the standard deviation is 10. For example, a pitch that is one standard deviation above the mean would be graded as a 110. Below is a table that displays the average aStuff+ and standard deviation of each pitch type, as well as a table displaying the aStuff+ that each pitch type would receive if it was a 50, 60, 70, or 80 on the scouting scale.
For the pitcher leaderboards, I calculated the aStuff+ of each pitch and each pitcher from the 2021, 2022, and 2023 seasons. In these leaderboards, 2024 data runs through May 22nd. Here are the top 10 aStuff+ leaders and bottom 10 aStuff+ laggards from the past three full seasons:

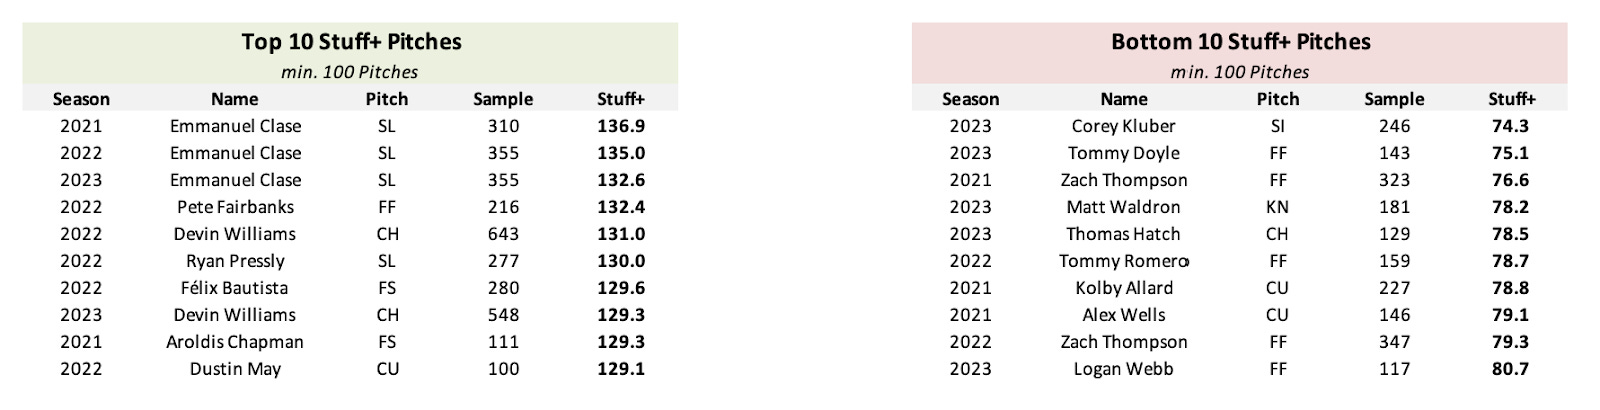
As shown by the tables above, it is a good indicator of aStuff+’s effectiveness that pitchers who are known for having the “nastiest” pitches are at the top of the leaderboard while the bottom of the leaderboard is filled with pitchers with underwhelming performance. The model is a big fan of Emmanuel Clase, with his Slider grading out as the best pitch in baseball over the past three seasons. With the exception of 2022 Pete Fairbanks, Clase also grades as the best pitcher in all of baseball by measure of aStuff+ over the past three seasons. It is also interesting to see that the top of the aStuff+ leaderboard is filled with relief pitchers, which makes intuitive sense since relievers typically throw harder at maximum effort, and/or have above-average stuff and below-average command which put them into a relief role in the first pitch. Among starting pitchers, 2022 Dustin May’s Curveball ranked as the highest grading pitch, while 2022 Tyler Glasnow had the best overall aStuff+ among starting pitchers (119 aStuff+).

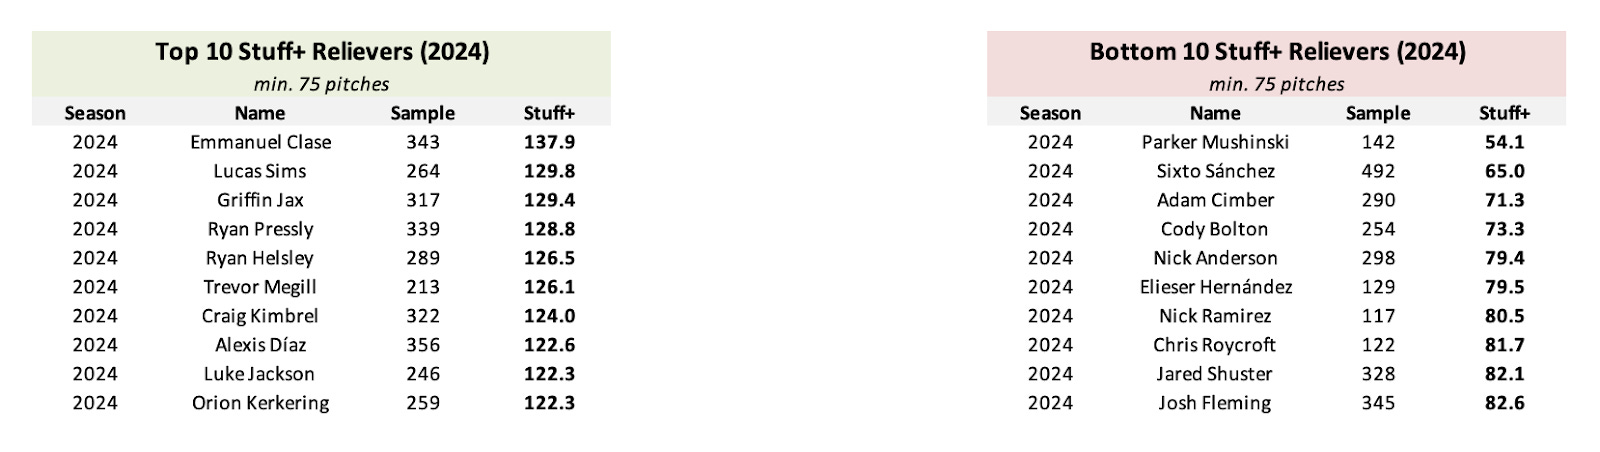

The tables above display the top 10 leaders and bottom 10 laggards in overall aStuff+ among starters and relievers, as well as among individual pitch types during the 2024 season. As mentioned earlier, these values are calculated through the end of gameplay on May 22nd. Tyler Glasnow is on pace to break the record for highest starter aStuff+, as he currently has a 122.8 aStuff+. Early season breakout pitchers such as Luis Gil and Jared Jones both rank within the top 5 of starter aStuff+ so far this season. Emmanuel Clase still possesses the top aStuff+ among relief pitchers, while Griffin Jax and Lucas Sims are throwing Sliders that grade better than Clase’s so far this season.
One reason why I wanted to create my own pitch quality metric was that I wanted to be able to conduct Stuff+ related research on topics beyond simply evaluating a pitcher’s arsenal. Analyzing the Stuff+ of pitches that hitters face has been a recent fascination of mine, and I attempted to analyze this using monthly FanGraphs Stuff+ data over the offseason. By applying my model to the data, I can create a more precise analysis of the quality of pitches a hitter has faced rather than approximating the pitch quality based on trend data.

As shown by the tables above, Nolan Jones and Charlie Blackmon faced the lowest opposing aStuff+ during the 2023 season, while Harold Ramírez and Randy Arozarena faced the highest aStuff+. There are two main takeaways from these leaderboards. One takeaway is that over the course of a full season, a typical hitter will face average stuff from opposing pitchers, as all of these values are close to 100. Another takeaway is the effect that altitude and environmental effects have on aStuff+, as 7 out of the 10 hitters who faced the lowest opposing aStuff+ played for the Colorado Rockies last season and 9 out of the 10 hitters who faced the highest opposing aStuff+ played for either the Rays, Blue Jays, or Marlins - all teams that play in domed or retractable roof stadiums (opposing pitchers apparently always throw their best pitches to Aaron Judge).
While to my knowledge FanGraphs Stuff+ adjusts pitch movement for altitude, my model does not include an environmental adjustment which would explain why this phenomenon exists in my model. Whenever I construct Volume 2 of aStuff+, I will be sure to include an adjustment for altitude’s effect on pitch movement.
As explained by Max Bay, his Pitching+ model has more of a relationship with offensive production than his Stuff+ model does, and I will make the assumption that the same is true with aStuff+. From an advance scouting standpoint, I am interested to see if analyzing opposing aStuff+ can provide insight on specific hitter-pitcher matchups. This will certainly be a line of research that I will be pursuing in the near future.
Concluding Thoughts:
Overall, I have been very impressed with the results of my pitch quality model, and I am excited to see what new insights aStuff+ can provide to baseball analysis in the future. Despite all of my praise of this model, there are a few limitations to the model. The first limitation is the aforementioned lack of altitude/environment adjustment, which means that pitches thrown at high elevation like Coors Field are likely to grade lower than pitches thrown in controlled environments like Tropicana Field. The second limitation is that aStuff+ by nature does not include information about the pitch’s location so a pitcher’s command plays little to no influence in the results of the model. The final limitation is there are no inputs that describe the sequencing of each pitch. While it can be assumed that a pitch’s effectiveness would decrease if it was utilized multiple times in a row, aStuff+ makes no such distinction of the prior pitch in a given sequence. Pitch sequencing is a topic that has intrigued me in recent months and I have made a few attempts to model effective pitch sequences, with no avail at the moment. Perhaps pitch sequencing data can be a factor in the aStuff+ model in the future.
I am currently working on an aStuff+ leaderboard table as well as other visualization tools that should be available on Substack in the coming days. In addition to making adjustments for altitude and environment for aStuff+ Volume 2, I am currently working on my own Location+ and Pitching+ models which will hopefully be completed in the near future. In conclusion, I am excited to finally release my pitch quality model to the public and I am excited to see all of the insights that aStuff+ will provide in the future.
Thanks for reading!
Follow @MLBDailyStats_ on X and Adam Salorio on Substack for more in-depth MLB analysis. Photo credits to USA Today.
*View the current aStuff+ leaderboards at the attached hyperlink*
Special thanks to Owen McGrattan, Cameron Grove, Thomas Nestico, Drew Haugen, and Driveline Baseball, as my pitch quality model would not be possible without their respective publications on the topic.