


Introducing My Swing Decision Model Vol. 2
Incorporating each hitter’s nitro zone into swing decision evaluation.


Over the past few weeks, I have been thinking a lot about the swing decision quality of Major League Baseball hitters. Making a split-second decision regarding whether to swing or take is alongside hitting a baseball among the most difficult tasks to accomplish in all of sports, and while there have been multiple advancements over the past couple of seasons in the public sphere (such as Robert Orr’s SEAGER metric and Drew Haugen’s SwRV metric) regarding measuring the quality of a hitter’s swing decisions, I believe that there is still room to go in fully understanding how to measure and quantify the quality of a hitter’s swing decisions.
Earlier this month, I released the first version of my swing decision model, SOTO, to the public. SOTO predicts the expected run value of a Swing Or Take Only by creating two predictive models (one for swings, another for takes) that utilize the location and count of each pitch to predict the expected run value of each pitch. While SOTO v1 performed quite well, performing better at describing and predicting BB% than O-Swing%, and wOBA and ISO better than Z-O Swing%, I felt there were improvements to the model that were still possible. Anecdotally, it appeared that the model primarily explained a hitter’s ability to draw walks rather than their ability to make selective swing decisions that maximize their potential to generate offensive production, which is the objective that I wanted SOTO to achieve. Therefore, I decided to make two major adjustments to my swing decision model, including adding a variable to indicate whether or not the pitch was located in the hitter’s “nitro zone” and altering the method of SOTO’s calculation, resulting in the creation of SOTO v2.
Background:
This article will primarily focus on the changes that I have made to my swing decision model in order to create SOTO v2. For a more detailed explanation of the importance of evaluating swing decisions and how an XGBoost model is constructed and evaluated, it is strongly encouraged to check out my initial article on the topic, Introducing My Swing Decision Model.
Changes to SOTO v2:
As mentioned in my article introducing SOTO, a shortcoming of the model was that it assumed that each hitter has the same “nitro zone”, while in reality, hitters have different locations throughout the zone where they frequently make their loudest contact. I have been intrigued by this concept since Rylan Domingues, formerly of Tread Athletics, published in 2022 that hitters perform better when they swing less at pitches located outside of their nitro zone. This concept makes intuitive sense to me, as hitters should swing most frequently at pitches which they are most confident in their ability to generate hard contact against. Domingues defined the nitro zone as the zone in which a hitter produced the Top 5% of their exit velocities. I finally figured out how to create a convex hull to represent the shape of each hitter’s nitro zone in Python, so I created a convex hull representing the nitro zone of each hitter (grouped by season), identified whether or not each pitch thrown was located in the hitter’s nitro zone, and included a nitro zone categorical variable as a predictor in the swing and take models. As will be demonstrated in the feature importance section, whether or not each pitch is located in the hitter’s nitro zone plays a major role in determining the expected run value of a swing or a take, and improves the results of both models. To verify that I calculated each hitter’s nitro zone correctly, I compared Rylan’s calculation of Bryce Harper’s 2022 nitro zone to the calculation that I conducted (please keep in mind the differences in pitcher/catcher perspective between our respective visualizations).

Another adjustment that I have made to the model is that I decided to change the way that SOTO is calculated. In my initial model, I applied the predictive models to each hitter’s swings and takes, and then calculated a weighted average of each hitter’s expected run value on swings and expected run value on takes. This weighted average is then expressed in the form of xRV/100 pitches, creating SOTO. While the performance of the model was impressive when compared to the performance of “traditional” plate discipline metrics such as O-Swing% and Z-O Swing%, I felt as if the model could better explain the impact that swing decisions have on overall offensive performance. To accomplish this, I was drawn to the method in which the award-winning swing decision metric SEAGER was calculated, and decided to apply this methodology (which I refer to as the “SEAGER framework”) to my swing and take models.
In SOTO v2, the swing and take models are applied to each pitch in the dataset, and a third model (a called strike predictive model) is used to weigh the predictions so that the edges of the zone would retain their “coin toss” nature. Then, the difference between the expected swing value and expected take value is taken to identify whether the pitch should have been swung at or taken (positive values indicate that the pitch should have been swung at, negative values indicate that the pitch should have been taken). Using this “expected difference” metric, two statistics have been created, Hittable Take% and Correct Take%. Hittable Take% is calculated as the percentage of a hitter’s takes that had a positive “expected difference”, while Correct Take% is calculated as the percentage of a hitter’s correct decisions (as indicated by the “expected difference”) that are takes. Correct Take% is then subtracted by Hittable Take% to create SOTO, which is then scaled on a 100 mean/10 standard deviation scale to create SOTO+.
Feature Importance:
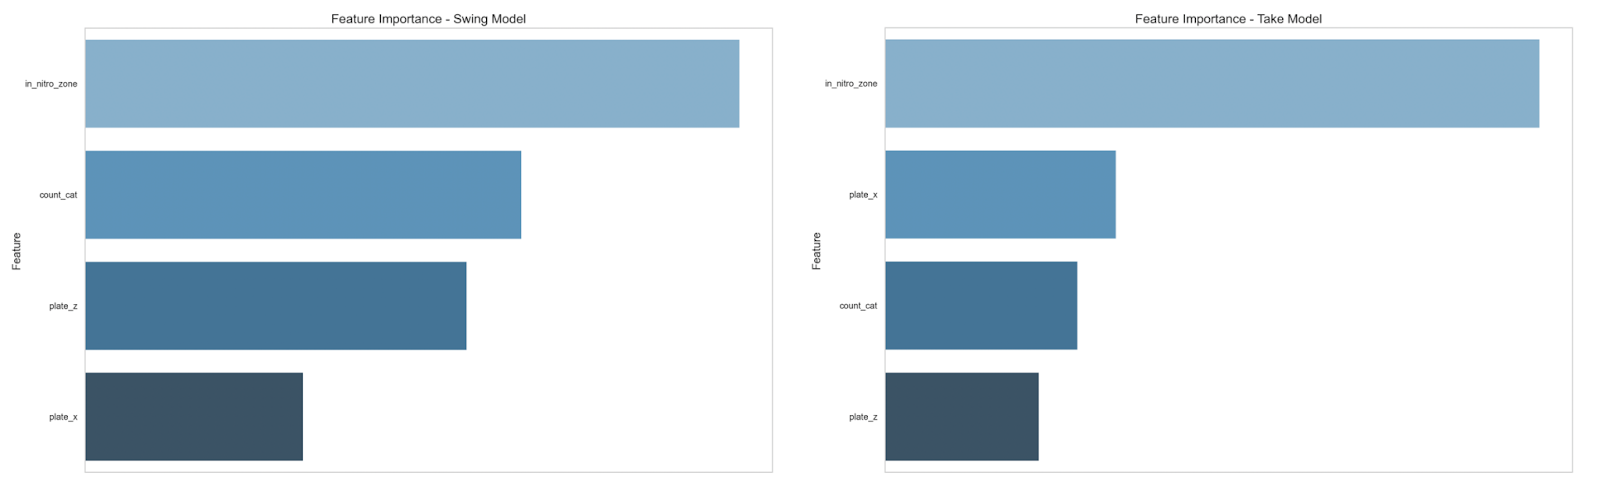
The table above displays the feature importance of all the variables in the XGBoost regression models for swings and takes. As mentioned earlier, the categorical variable indicating whether or not each pitch was located in the hitter’s individual nitro zone is the most important variable in each model, followed by the location and count scenario of each pitch. Swinging at pitches in the nitro zone is valued positively by the model, as this is the location in the zone where the hitter is expected to generate the most damage, while swing decisions on 3 ball and 2 strike counts are valued heavily since the outcomes of these decisions lead directly to walks or strikeouts.
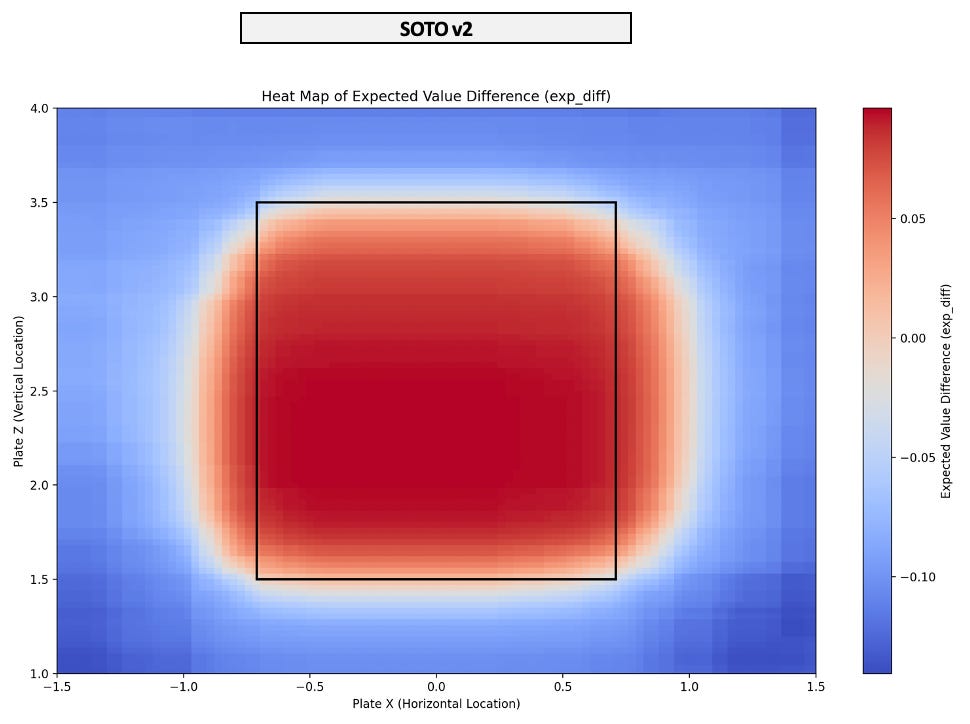
As shown by the heat map above, the expected run value for swings and takes appear to be successfully valued based on pitch location, with swings being highly valued when taken within the strike zone as opposed to well outside the zone. Unlike SOTO v1, there are positive expected run values on swings taken at pitches on the edges and slightly outside the zone, and I believe this can be attributed to the fact that a hitter’s nitro zone can extend to an area outside of the strike zone.
Descriptive + Predictive Performance:
Creating a model whose results make intuitive sense is only one step of the equation. Ensuring that the model is able to predict future performance, as well as describe the current performance of a hitter regarding their swing decisions is the real value of creating a model like SOTO. To measure the descriptive and predictive abilities of the new swing decision model, I will evaluate the correlations of SOTO v2, SOTO v1, O-Swing%, and Z-O Swing% with BB%, wOBA, and ISO. I will construct three separate tables for each analysis, grouped by minimum plate appearances (100, 250, and 500). For the descriptive analysis, I will compare Y1 data to itself, while I will compare Y1 data to Y2 for the predictive analysis. I will also compare the aforementioned metrics to SEAGER utilizing the correlations provided in the article’s introductory article, which appears to be calculated with a plate appearance minimum of around 250.
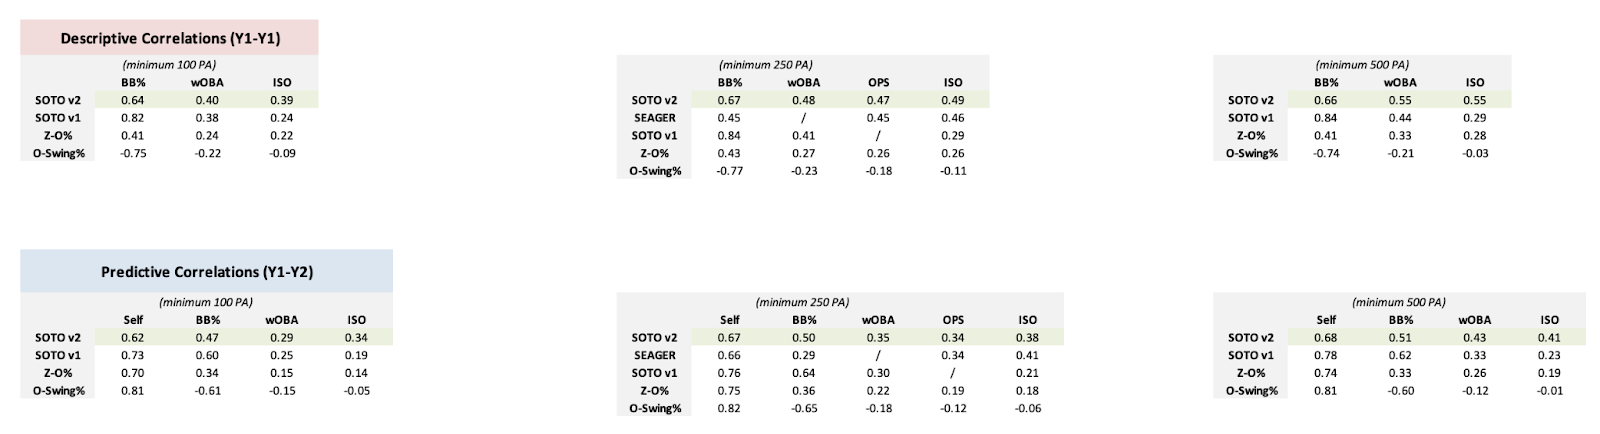
As shown by the tables above, SOTO v2 is a superior descriptive and predictive metric in evaluating a hitter’s swing decisions (based on correlations to wOBA, the measure of a hitter’s overall offensive production) than SOTO v1. While SOTO v1 is better at describing and predicting a hitter’s BB%, SOTO v2 is superior at describing and predicting a hitter’s ISO. In essence, SOTO v2 acknowledges that swing decisions are more than simply evaluating how well a hitter is a drawing walks, rather swinging at pitches that an individual hitter is capable of driving for power is also an integral component of evaluating a hitter’s swing decisions.
When compared to SEAGER, SOTO v2 performs better as a descriptive metric across all categories and is better at predicting itself year-to-year. While both metrics possess the same correlation coefficient at predicting Y2 offensive production (in this case, by the measure of OPS), SOTO v2 does a better job at predicting BB% while SEAGER does a better job at predicting ISO.
SOTO v2 is less sticky year-to-year than my initial model, however, the new model performs better at predicting Y2 wOBA than SOTO v1 in both small and large sample sizes. As it pertains to BB%, SOTO v1 remains the superior descriptive and predictive metric. Given these descriptive and predictive correlations, I can conclude that SOTO v2 is superior at describing and predicting offensive production based on a hitter’s swing decisions than SOTO v1.
SOTO Leaderboards:
Similar to SOTO v1, to more easily interpret the results of the swing decision model, I scaled each hitter’s SOTO relative to the league average in a given season (SOTO+). SOTO+ is scaled so that league average swing decisions are graded as 100, with 10 equaling one standard deviation. For example, a hitter who displays swing decisions that are one standard deviation above the mean would be graded as a 110.
As discussed in my original article, the lack of a universal designated hitter during the 2021 season had a significant effect on the league average and standard deviation for that season, as the presence of pitchers batting resulted in worse overall swing decisions across the league. Please keep this in mind when evaluating SOTO+ values from the 2021 season.
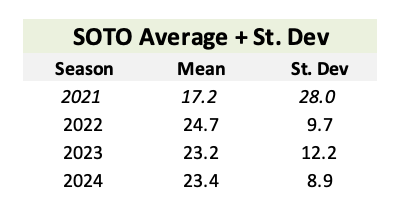
For the leaderboards, I calculated the SOTO and SOTO+ for each hitter from the 2021, 2022, 2023, and 2024 seasons. In these leaderboards, 2024 data runs through September 23rd. Here are the top 10 SOTO leaders and bottom 10 SOTO laggards from the past three full seasons:

As shown by the table above, it is a good indicator of SOTO’s effectiveness that hitters who are known for making good swing decisions are at the top of the leaderboard while the bottom of the leaderboard is filled with hitters who are known for making poor swing decisions. Bryce Harper and Corey Seager rank as two players who consistently make good swing decisions, while contact-oriented “free-swingers” such as Jose Iglesias and David Fletcher are present at the bottom of the leaderboard.
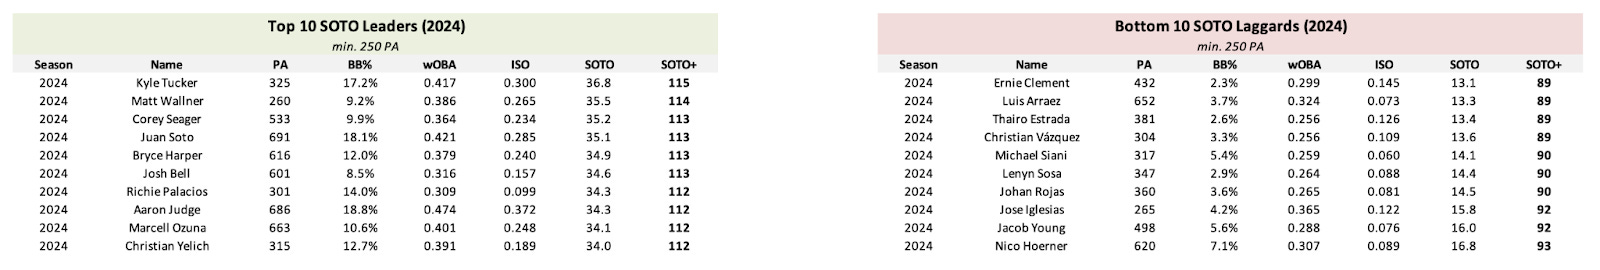
So far this season, Kyle Tucker reigns supreme with the best swing decisions in Major League Baseball with a 115 SOTO+. Perennial SOTO leaders Bryce Harper and Corey Seager also appear among the top 5 players with the best swing decisions in baseball this season. Consistent with SOTO v1, SOTO v2 is impressed by the swing decisions of Richie Palacios of the Tampa Bay Rays (112 SOTO+), and I am very intrigued at his potential to increase his level of offensive production next season, either by continuing to add bat speed or lowering his swinging strike rate and pulling the ball in the air more frequently.
SOTO Aging Curves:
Another means of utilizing a swing decision model like SOTO can be as a tool to project how well or poorly a player’s swing decisions can be expected to age over the course of their career. To analyze how well a player’s swing decisions age over the course of their career, I constructed a simple aging curve, utilizing the “delta method” to analyze each player’s year-to-year difference in SOTO, grouped by age. To enhance the interpretability of the aging curve, I also implemented LOWESS to create a smoothed aging curve.

As shown by the aging curve above, it can be expected that a player’s ability to make swing decisions consistently declines throughout their career by measure of SOTO. This is counter to the results of the SOTO v1 aging curve, which indicated that a hitter’s swing decisions slightly improve early in their careers before declining after age 28 (and especially after age 30). Similar to the results of the SOTO v1 aging curve, SOTO v2 indicates that a player’s decline in ability to make good swing decisions accelerates after age 29, before plateauing and improving around age 33 (likely a result of a smaller sample size and survivorship bias).

Taking a look “under the hood” at the aging curves of Correct Take% and Hittable Take%, it appears that a hitter’s ability to identify correct pitches to take increases slightly between ages 26 and 28 before beginning to decline, while a hitter’s ability to swing at pitches that are hittable remains constant throughout the early part of their career before beginning to decrease dramatically at age 32. Utilizing Correct Take% and Hittable Take% as proxies for O-Swing% and Z-Swing% respectively, this is consistent with older research conducted by Bill Petti on aging curves for plate discipline metrics. While the results of the aging curve past age 35 can largely be ignored, I believe that the consistently declining nature of the SOTO aging curve indicates that making good swing decisions is a skill that is imperative for hitters to have to keep playing at the Major League level deep into their 30s.
Incorporating SOTO w/ Bat Tracking Metrics:
In May, Statcast released its first batch of public bat tracking data, including bat speed and swing length for each swing taken during the 2024 season. In addition to this raw data, Statcast also released a variety of metrics such as Blast% and Squared Up% that can be used to better measure contact efficiency across Major League Baseball.
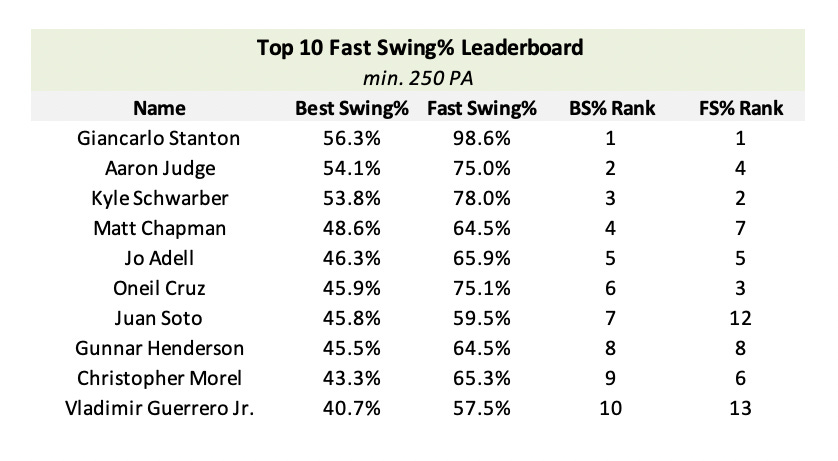
In my initial article on swing decision modeling, I created a new bat tracking metric utilizing the SOTO model, Best Swing%. Best Swing% is calculated as the percentage of swings that a hitter takes that have a bat speed of at least 75 MPH and was on a pitch with a positive “expected difference” (the difference between expected swing run value and expected take run value). As a result, Best Swing% was marginally better at describing wOBAcon, xwOBAcon, wOBA, and ISO than Fast Swing% (the percentage of swings a hitter takes with a bat speed of at least 75 MPH, regardless of pitch location) and was a better metric at describing wOBAcon, xwOBAcon, and wOBA than average Bat Speed. Given that I constructed new swing and take models as part of the creation of SOTO v2, I decided to once again calculate Best Swing%, using the same parameters with the new models.

As shown by the correlation table above, Best Swing% remains marginally better at describing wOBA, wOBAcon, xwOBAcon, and ISO than Fast Swing%. Best Swing% is also a better metric at describing wOBA, wOBAcon, and xwOBAcon than average Bat Speed. While bat tracking metrics are still in their infamy on the public side, with the release of more metrics such as contact point and year-to-year data needed in order to create effective descriptive and predictive swing models, the performance of Best Swing% indicates that there is demonstrable value in taking “fast swings” at pitches in ideal locations.
Concluding Thoughts:
While SOTO v2 does an excellent job at evaluating each player’s ability to make good swing decisions, there are a couple of limitations to the model that I wish to improve upon in the future. The first limitation regards how each hitter’s nitro zone is constructed. While the addition of a nitro zone variable to the model improves the performance of both the swing and take models, the variable does not take into account how the shape of a hitter’s nitro zone may change over the course of the season. For example, a hitter’s nitro zone at the beginning of the season may not include pitches that are up-and-in but expands to include this area later in the season, therefore, the model will treat any pitches located up-and-in as retroactively in the nitro zone. In addition, the nitro zone does not include any minimum launch angle requirement which might lead to certain hitter’s nitro zones consisting of areas in which they frequently hit the ball hard into the ground. While hitting the ball hard on the ground is certainly better than hitting the ball soft on the ground, the best batted ball outcomes consist of hitting the ball hard in the air, and an ideal nitro zone should be a location in the zone where these outcomes occur most frequently.
The perceived change in shape of a hitter’s nitro zone over the course of the season is the primary reason why I did not perform a stabilization analysis for SOTO v2, certainly a shortcoming of the analysis, however, as evidenced by the descriptive and predictive performance of SOTO v2, I believe that the current iteration of the nitro zone is sufficient for the time being. I plan to incorporate the changes in the shape of a hitter’s nitro zone and add a launch angle baseline for the nitro zone in SOTO v3 after I conduct further research to identify the proper parameters for these adjustments.
A continuing limitation of SOTO is that the model does not take into account the pitch type of the incoming pitch, treating all pitch types the same. I primarily decided to leave this variable out of my model for two reasons. One reason is that there is some ambiguity between pitch classifications (such as pitchers who throw a sweeper, but it is classified by Statcast as a slider), and I did not want these differences to have an impact on the results of the model. While including the physical characteristics of each pitch into the model could’ve resolved any classification issues, this would raise an additional question of which features make an impact on a hitter’s decision-making process at the plate. When conducting some research regarding how other analyst’s swing decision models were created, I came across Driveline Baseball’s swing decision model which takes into account how well hitters perform against certain pitch types. This makes intuitive sense to include this variable in a swing decision model, as hitters should swing more frequently at pitch types that they perform better against. This is certainly a variable that I will be exploring to add to SOTO v3 in the future.
Making good swing decisions provides a hitter with a solid foundation to generate offensive production, however, improving a hitter’s swing decisions can often be a difficult task. While nearly every hitter steps into the batter’s box with the intention to only swing at pitches in the strike zone, it is the ability to decide within milliseconds whether to swing or take that separates the hitters with good swing decision ability from those with poor swing decision ability. Utilizing the “expected difference” method to identify pitches that hitters should swing at, Major League Baseball hitters still have a ways to go before reaching complete swing decision optimization.

Good Swing% is calculated as swings that hitters took at pitches with a positive “expected difference” divided by the total number of pitches, and Good Z-Swing% is calculated as swings that hitters took at pitches in the strike zone with a positive “expected difference” divided by the total number of pitches in the strike zone.
It should be expected that the ideal swing rate according to my swing decision model would be lower than the actual swing rate since it is unreasonable to expect Major League Baseball hitters to chase out of the zone at a near-zero rate, however, there is a consistent gap between Z-Swing% and ideal Z-Swing%. Over the past four seasons, Z-Swing% has consistently been around 68%, while the ideal Z-Swing% has hovered around 62-62.5%. Major League Baseball hitters as a whole improved at making effective swing decisions in the strike zone from 2021-2023, however, these gains have been reversed in 2024 with the difference between Good Z-Swing% and Z-Swing% at a four-year high.
In my opinion, the next competitive advantage in Major League Baseball as it pertains to developing hitters will be having an effective means to improve a hitter’s swing decisions. With realistic pitching machines such as Trajekt available in many Major League organizations, players now have the opportunity to receive many more repetitions against Major League-quality pitching than was previously available, which can result in an improvement in swing decision ability.
Perhaps this is also an area of player development where neuroscientists and sports psychologists can provide insights into how to put a hitter’s mind in the right condition for making quick, important decisions such as deciding whether to swing or take at a given pitch. I am also intrigued by the prospect of tracking a hitter’s eye movement during the pitch, as displayed in this excellent Lance Brozdowski video, and perhaps this data can provide insight into where a hitter should place his visual focus during the delivery of a pitch. Speaking from experience as an amateur baseball umpire, I can notice a difference in my strike zone judgment when I focus my eyes in an inconsistent location, and I would imagine that the same phenomenon exists with Major League Baseball hitters as well.
From an advance scouting perspective, compiling a detailed game plan also plays a valuable role in improving a hitter’s swing decisions at the plate and can also contribute to creating a competitive advantage regarding swing decision optimization, as the quality of today’s pitching necessitates that each hitter has a plan of attack at the plate in order to maximize their level of offensive production.
I am currently working on an interactive SOTO leaderboard and other visualization tools that should be available on Substack in the coming days, weeks, and months. I am excited to release my updated swing decision model to the public and I am excited to see all the insights that SOTO will provide in the future.
Thanks for reading!
Follow @MLBDailyStats_ on X and Adam Salorio on Substack for more in-depth MLB analysis. Photo credits to Kyle Ross-USA Today Sports.
*View the current SOTO leaderboard at the attached hyperlink*