


Modeling Salary Arbitration: Part Two — Pitchers
(10/2/22) Modeling raises awarded in salary arbitration to Major League Baseball pitchers.

Originally published on Medium on October 2, 2022.
Welcome to Part Two of my multi-part series in which I explore the Major League Baseball arbitration process, and formulate a model that can be used to project salaries for arbitration-eligible players. In this article, I will focus on pitchers and create two linear regression models, in order to identify which metrics significantly contribute to a player’s arbitration value, and create a preliminary arbitration model that can be used to project starting and relief pitcher’s salaries.
Background:
To review, Major League Baseball players that have between three and six years of service time, or have two years of service time and are designated as a “Super Two”, are eligible for arbitration if they are unable to reach a contract agreement with their respective team before arbitration hearings begin at the end of the offseason. Both sides present to the arbitration panel a salary offer for the upcoming season, and the panel chooses which proposal will become the player’s salary. One storyline that has developed in recent years is that arbitration panels are more inclined to award salaries based off of a player’s traditional statistics, as opposed to advanced metrics which are often more indicative of a player’s value to their team. With this perceived discrepancy present, it is imperative that teams identify which variables influence the arbitration panel’s decisions in order to understand how players are valued by the panel, and identify which players might remain undervalued during their years of arbitration eligibility.
Data:
In this article, I am going to focus on modeling salary arbitration for pitchers. The dataset that is being used will be all salary arbitration hearings that have been held since the beginning of the 2015 Major League Baseball season, which total 50 arbitration hearings for pitchers. In an attempt to better project awarded salaries, I have broken this larger dataset into two smaller datasets. The “Starter” dataset consists of players who were the starting pitcher in at least half of their appearances during a given season, and the “Reliever” dataset consists of the remaining players who did not start in at least half of their games played. The dependent variable in the linear regression will be the players awarded raise from the previous season. Statistical variables in the datasets include Wins, Saves, ERA, SO/9, BB/9, HR/9, WHIP, Innings Pitched, and a dummy variable of whether or not the player was on his league’s All-Star team during the prior season.
“Starter” Regression Model:
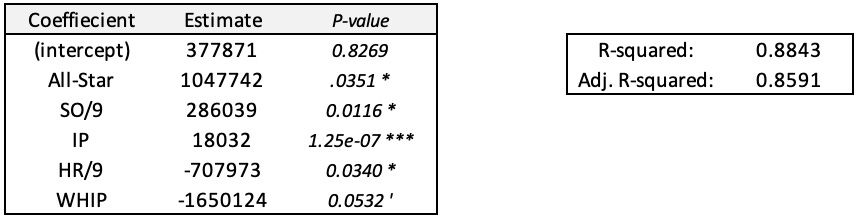
In the linear regression model of the 32 starting pitchers in the dataset, there is a statistically significant relationship between the amount of a player’s awarded raise and their SO/9, HR/9, Inning Pitched, and WHIP from the previous season, and whether or not they were an All-Star during the preceding season. These five variables are able to explain 88.4% of the variance in player’s arbitration raises for starting pitchers. Appearing in an All-Star Game in the preceding season has a particularly significant effect on a player’s salary, as the player can expect a raise of $1,047,742 as a result. Each 1.0 increase in SO/9 and HR/9 during the previous season is worth $286,039 and -$707,973, respectively, each Inning Pitched can expect a raise of $18,032, and each 0.10 increase in WHIP decreases a player’s raise by $165,012.
Gerrit Cole’s $6,750,000 raise for the 2019 Major League Baseball season was the highest awarded raise during this time period for starting pitchers. Shelby Miller’s $200,000 raise for the 2018 Major League Baseball season was the lowest awarded raise for arbitration starting pitchers during this time period. Most of Gerrit Cole’s salary increase can be attributed to the extraordinary high SO/9 (12.4) he produced during the 2018 season, as well as his appearance in that season’s All-Star Game.
“Reliever” Regression Model:
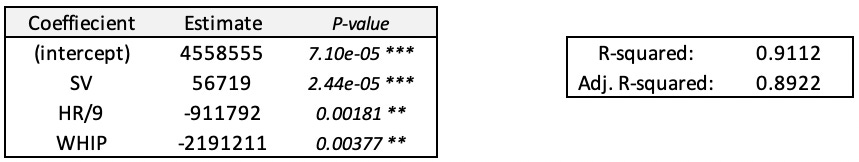
In the linear regression model of the 18 relief pitchers in the dataset, there is a statistically significant relationship between the amount of a player’s awarded raise and their Saves, HR/9, and WHIP from the previous season. These three variables are able to explain 91.1% of the variance in player’s arbitration raises for starting pitchers. Each save a relief pitcher earns in the preceding season has a particularly significant effect on a player’s salary, as the player can expect a raise of $56,719 per each save as a result. Each 1.0 increase in HR/9 during the previous season decreases a player’s raise by $911,792, and each 0.10 increase in WHIP decreases a player’s raise by $2,191,211.
Roberto Osuna’s $4,747,600 raise for the 2018 Major League Baseball season was the highest awarded raise during this time period for relief pitchers. Lucas Sims’s $601,500 raise for the 2022 Major League Baseball season was the lowest awarded raise for relief pitchers during this time period. Most of Roberto Osuna’s salary increase can be attributed to the 39 saves he accumulated during the 2017 season, along with an extraordinarily low WHIP of 0.859 he produced that season.
Interpretations + Conclusion:
Overall, both of these regression models are able to explain at least 88% of the variance in player’s salaries awarded by the arbitration panel. Upon this initial exploration of player data, it appears that WHIP and HR/9 are the most influential variables to the arbitration panel for both starting and relief pitchers. For starting pitchers; SO/9, Innings Pitched, and whether or not a player was selected to the All-Star Game are additional influential variables to the arbitration panel, while Saves are influential when determining a relief pitcher’s raise for the following season.
For starting pitchers, the results of this regression model indicate that they are valued rather fairly by the arbitration panel, as SO/9 and HR/9 are generally good metrics for evaluating a pitcher’s true value. WHIP is not exactly a perfect metric for evaluating a pitcher’s value (as it takes into account balls in play, which can cause a pitcher with a poor defense to have a higher WHIP due to more overall hits allowed), however it is a “better” metric to use than ERA. One element in which a starting pitcher can be over/undervalued in the arbitration process is through the value the arbitration panel places on Innings Pitched. This provides teams with more incentive to have starting pitchers pitch less innings per game and build deeper bullpens, because the arbitration panel places less value on starters who pitch fewer innings.
For relief pitchers, the results of this regression model indicates that the arbitration panel places a lot of value on how many Saves a reliever accumulates during a given season. Due to the nature of the Save statistic, this will result in Closers being overvalued by the panel while Middle Relievers will almost always be undervalued in the arbitration process. It is also interesting to note that SO/9 is not a significant statistic for the arbitration panel when determining a raise, despite the fact that a reliever’s Strikeout Rate is one of the most important statistics to use when evaluating a pitcher’s true value. This discrepancy in valuation explains as to why it makes more financial sense for teams to deploy either a “closer-by-committee” approach or utilize their best relievers in the most high-leverage situations of a particular game as opposed to a set 9th-inning role, which would result in the accumulation of a lot of Saves, potentially overvaluing said reliever to the arbitration panel.
It should also be noted that I elected to remove the 2021 arbitration hearings (held after the 2020 Major League Baseball season) from the dataset. This is due to the shortened season that took place in the 2020, which would cause disruption in the final results as it became apparent during the model construction process that arbitration panels place value on metrics that are collected as cumulative totals.
In conclusion, I believe that these two regression models will serve as a strong foundation for the model I will construct and use to forecast arbitration raises this winter. After further refinements to the aforementioned pitching models, along with the previously constructed offensive player models, I will be able to project 2023 salaries for arbitration-eligible players, which will be discussed in further detail in Part 3 of this series.
Follow @MLBDailyStats_ on X (Twitter) for more in-depth MLB analysis. Statistics provided by Baseball-Reference and FanGraphs.