
A Closer Look at Swing Decision Metrics
Should we consider bat speed when evaluating swing decisions?


Over the past year or so, I have been fascinated with evaluating swing decisions. A hitter can only be as good as the pitches they swing at, and given how little time a hitter has to make a swing decision, this ability is nearly impossible to improve and is likely innate. Ted Williams once said, “the hardest thing to do in baseball is to hit a round baseball with a round bat, squarely”, and a hitter with a poor eye for discerning which pitches to swing at diminishes their odds of making such squared contact with each swing.
Displaying an ability to make good swing decisions is also very important because swinging the bat is often not the optimal strategy for the hitter, by measure of run value. While the most optimal outcomes a hitter can produce (home runs, barrels, hard hits, etc.) are generated by swinging the bat, very few hitters accumulate positive run value with their swings. As shown by this linked graph by Tom Tango, nearly all of the hitters that have generated net positive run value on swings throughout their career are currently in the Baseball Hall of Fame.
Given this negative relationship between swinging the bat and offensive run value, should a hitter swing the bat at all? Well, of course, they should swing the bat. As mentioned earlier, the most optimal outcomes a hitter can produce are generated by swinging the bat, and it is incredibly likely that pitchers would quickly adjust their approach to throwing more pitches that would generate called strikes, rather than swing and miss, when facing a hitter who has a 0% swing rate. The game theory implications of not swinging are certainly interesting, and Justin Choi wrote about it in an article for FanGraphs a couple of years ago for those with further interest in these implications.
This relationship illustrates the importance of making good swing decisions, and since hitters will likely produce a negative run value on their swings, it is imperative that they should only swing at pitches that they are confident can produce positive run value upon contact. While making good swing decisions is a very difficult task, given the mere milliseconds that a hitter has to make such a decision, there are a variety of metrics available to the public that can be used to evaluate which hitters are better at making swing decisions than others. This article will discuss the existing swing decision metrics that are available to the public, the shortcomings that exist in these metrics, and potential improvements that can be made to these metrics in the future to improve the evaluation of a hitter’s swing decisions.
Overview:
There are currently three “basic” metrics that are commonly used by the public to evaluate swing decisions: swing rate, chase rate, and zone minus chase rate. Swing rate is a good general measure of a hitter’s plate discipline (lower swing rate = good discipline), however, it does not distinguish between pitches located in and out of the strike zone. Chase rate (O-Swing%) takes it a step further by only evaluating pitches that are located outside of the strike zone and is a solid indicator of a player’s ability to draw walks, however, the metric does not take into account a hitter’s swing decisions on pitches within the strike zone. Zone minus chase rate (Z-O Swing%) attempts to accurately measure a hitter’s swing decisions by simply subtracting a hitter’s chase rate from their in-zone swing rate.
While these metrics are an excellent starting point for evaluating the quality of a hitter’s swing decisions, these statistics fall short in a couple of areas. First, while O-Swing% and Z-O Swing% differentiate between whether or not a pitch was located in the strike zone, they do not take into account the exact coordinates of each pitch. For example, a pitch right down the middle is treated the same as a pitch on the edge of the strike zone, when intuitively there is a higher expectation for the hitter to swing on the pitch down the heart of the zone. Second, these existing metrics do not take into account the count state of each pitch. A take on a 3-2 count is inherently more valuable than a take on a 0-0 count since the result of the 3-2 pitch will directly lead to a walk or a strikeout, however, the existing metrics do not take these factors into account.
Swing Decision Modeling:
To more effectively evaluate swing decisions by taking into account factors such as precise pitch location and count state, multiple analysts (including myself) have created swing decision models that use machine learning, in a similar manner to pitch quality models such as Stuff+, to evaluate the expected run value of each swing or take. Multiple methods can be used to model swing decisions, and I believe the two best public models are Drew Haugen’s SwRV and Robert Orr’s SEAGER.
Haugen’s SwRV calculates the expected swing run value and expected take run value, and formulates an expected swing decision run value based on whether takes or swings at a given pitch. SwRV does an excellent job at predicting future wOBA compared to other plate discipline metrics and performs similarly to chase rate as it pertains to evaluating a hitter’s ability to draw walks. Orr’s SEAGER attempts to measure each hitter’s ability to be “selectively aggressive” at the plate, subtracting each hitter’s “hittable takes” from their “correct takes” to formulate a Z-O Swing%-style swing decision metric.
SEAGER isn’t as good at describing or predicting BB% as well as other swing decision metrics, however, it performs very well at describing and predicting a hitter’s wOBA and ISO. As was the case with many observers, I was very impressed with the outcome of this model, considering its ability to evaluate such a large amount of offensive production based on swing decisions alone, and I ultimately decided to use this “SEAGER framework” when constructing my swing decision model, SOTO. To take it a step further, I also included a variable indicating whether or not each pitch was located in the hitter’s “nitro zone”, which improved SOTO’s performance compared to SEAGER. While I was initially quite proud of the SOTO model, I have over-time noticed a few drawbacks to swing decision models that use the “SEAGER framework”:
These models are difficult to explain in two sentences or less.
The predictions of these models are calculated on an aggregated level, not a pitch-by-pitch level, making it difficult to evaluate the swing decision quality of a given individual pitch.
These models might capture something other than swing decisions.
In addition to being effective mathematically, I believe it is just as important for a statistic to be easily interpretable and explainable, as it is ultimately the implementation of the findings of such a model that will make a difference in on-field performance. While I hope I did a good job explaining the “SEAGER framework” in the last paragraph, I personally find explaining the exact mechanism of how these models achieve their results quite difficult. Hitters have mere milliseconds to decide whether to swing or take at a given pitch, certainly not enough time to perform probability calculations under maximum external pressure.
Another drawback to using this framework to evaluate swing decisions is that the predictions are calculated on an aggregated level, not a pitch-by-pitch level. In other words, it is not possible to calculate the SEAGER or SOTO value for a given pitch, rather it has to be interpreted over a set amount of time (either pitches or plate appearances). When evaluating swing decision quality over the course of a season, this is not an issue, however, when attempting to use this framework to represent swing decision quality when constructing another model (as I described in my article last fall, Exploratory Data Analysis into Swing+ and Bat Tracking Data) this can cause some obstacles.
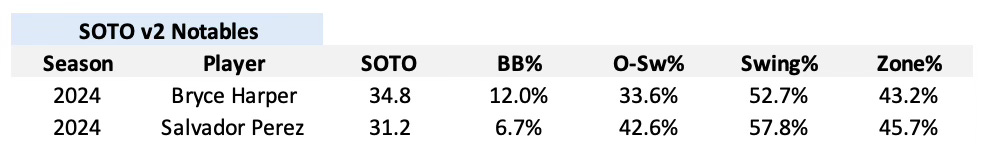
While perusing the SOTO v2 leaderboards at the end of the 2024 season, I was glad to see that players with high walk rates and high ISO’s were atop the leaderboard, however, there were a couple of players near the top that left me a bit puzzled. While Bryce Harper has been able to generate a double-digit walk rate every season of his career, his 33.6% chase rate last season seemed like it did not belong towards the top of a swing decision leaderboard, however, the high SOTO he produced last season could perhaps be attributed to his aggression inside of his nitro zone. More surprising was Salvador Perez’s presence towards the top of the leaderboards, as a 42.6% (!) chase rate and 6.7% walk rate are certainly not indicators that a player has plus swing decision ability. It appeared to me that SOTO was capturing something else besides swing decisions, so I decided to analyze the relationships between SOTO, SEAGER, Chase%, and various other process methods to determine if any other factors were influencing the swing decision grades.
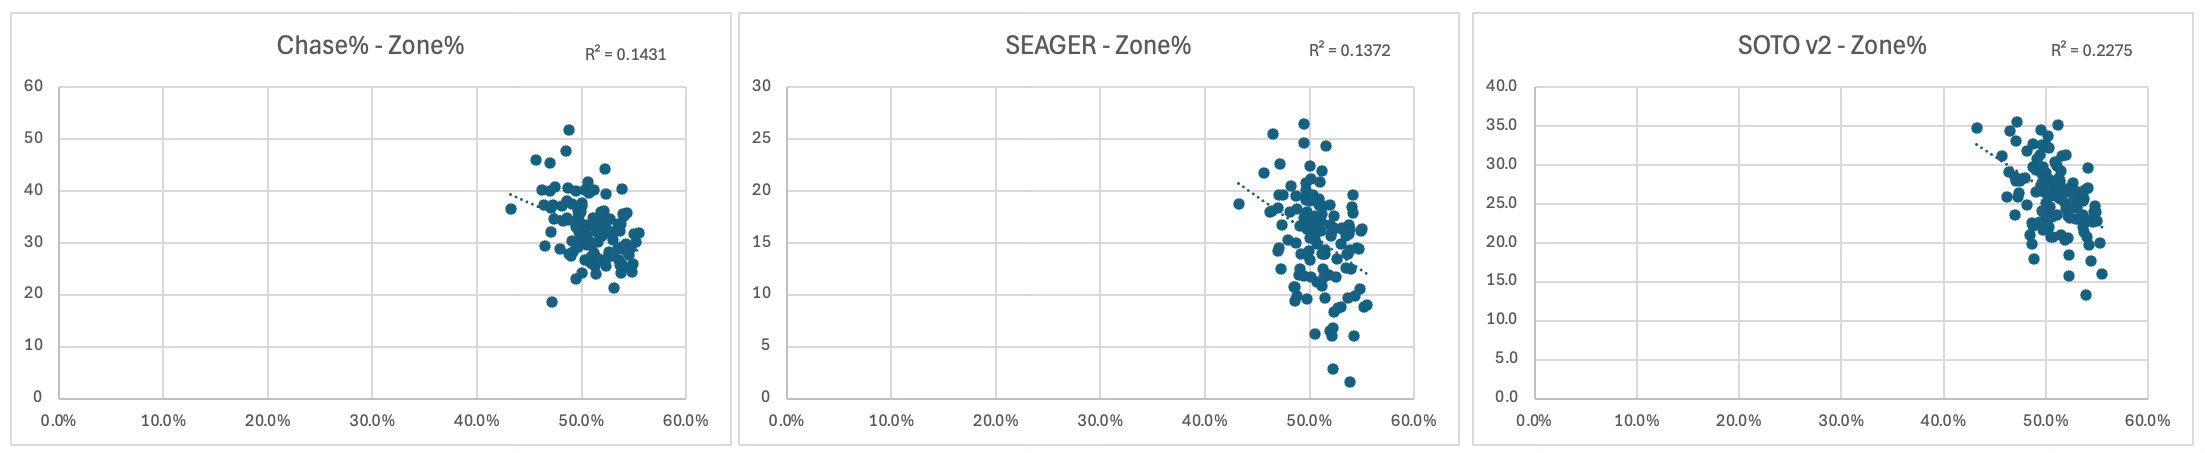
The tables above depict the relationship between Zone% (the percentage of pitches a hitter faces in the strike zone) and Chase%, SEAGER, and SOTO among hitters with at least 500 plate appearances in the 2024 Major League Baseball season (Zone% is on the x-axis). As shown by the graph above, Zone% explains nearly 23% of the variance in a player’s SOTO grade, indicating that hitters who face fewer pitches in the strike zone are likely to receive a higher SOTO grade. Since players who hit the ball hard tend to see fewer pitches in the strike zone, as pitchers would like to mitigate damage allowed against these hitters, this will bias SOTO to favorably grade the best all-around hitters in the game. Both Chase% and SEAGER also demonstrate a statistically significant relationship with Zone%, however, not to the extent that SOTO does.
Yes, this section of the article is meant to criticize my own swing decision model, and given this strong relationship that Zone% has with SOTO v2, I have decided to retire the use of this model moving forward. On the other hand, I must emphasize this analysis should not be taken as a criticism of SEAGER and I believe that the “SEAGER framework” reveals one important element of swing decision modeling which is that evaluating the quality of a hitters takes is more important than evaluating the quality of a hitters swings.
When constructing both versions of my swing decision model, I noticed that the swing model was less accurate than the take model as it pertained to predicting the expected run value of a pitch. This sentiment was echoed by Thomas Nestico when he constructed his swing decision model, and Drew Haugen wrote that “a hitter’s ability to avoid swinging at poor pitches is far more important to making good decisions than their ability to swing at strikes”. After some thought, this makes intuitive sense because while the value of a take largely remains the same for each hitter, the value of a swing largely varies depending on the skill level of the batter. For example, there is a larger range of potential outcomes, regardless of contact, when Giancarlo Stanton takes an 80 MPH swing on a pitch down the middle than when Luis Arraez takes a 62 MPH swing at a pitch in the same exact location.This leads me to believe that bat speed data can play an integral role in evaluating the quality of a hitter’s swing decisions. One benefit of the new bat tracking data released by Statcast is that it provides the public with bat speed data from nearly every swing, compared to pre-2024 when the public only had advanced metrics for hitters (exit velocity, launch angle, etc.) once contact was made. Perhaps including bat speed as a feature in a model predicting the expected run value of swings (regardless of swings) can help minimize this statistical noise and create an even better swing decision model. Fortunately, Statcast released bat tracking data from the second half of the 2023 season over the offseason and I decided to preliminarily construct a new swing decision model using bat speed as an additional feature when evaluating the quality of a hitter’s swings.
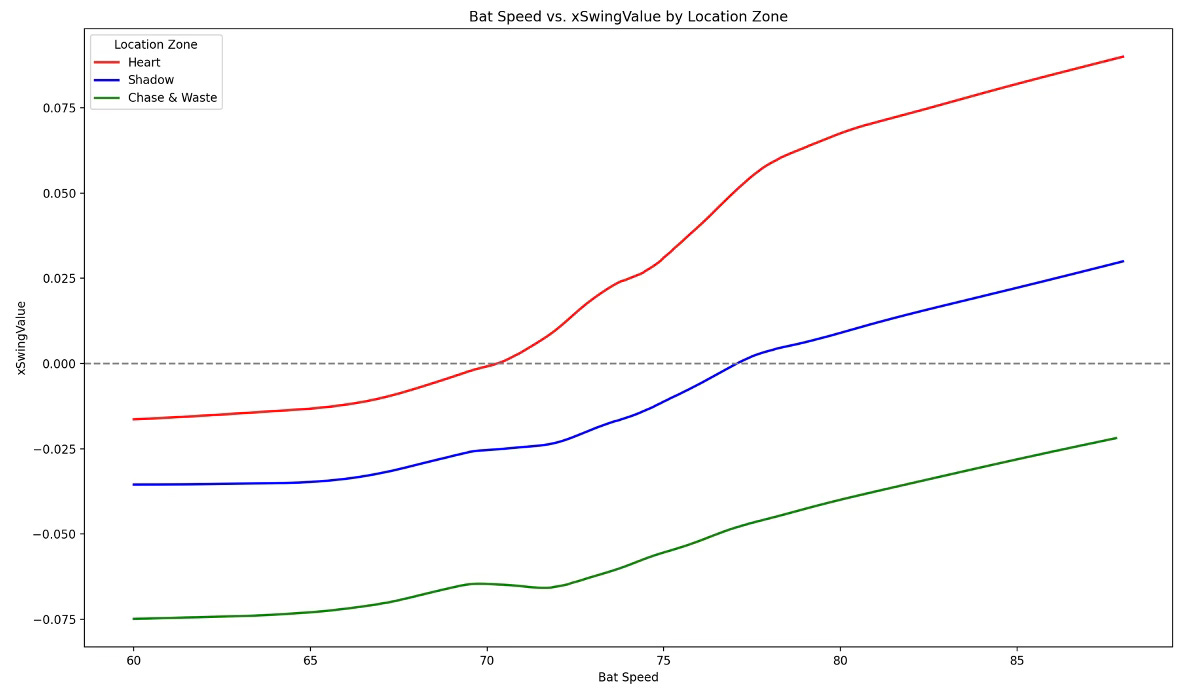
The table above depicts the expected run value of swings taken by hitters during the 2024 Major League Baseball season, grouped by location zone (heart, shadow, chase/waste) with bat speed on the x-axis. As shown by the table, swings are more valuable across all bat speeds when swung at pitches in the heart of the strike zone, while faster swings are more valuable than slower swings. Consistent with historical trends, most swings generate negative run value, however, swings on pitches in the heart zone with a bat speed over 70 MPH notably generate positive expected run value. I should stress that these are preliminary results, and there is simply not enough year-to-year data available to definitively conclude whether this model is an improvement over existing methods to evaluate swing decision quality. I will mention, however, that the early results are very promising and that the preliminary model constructed using this framework minimizes the relationship (R-squared) between the predictions and Zone% down to ~5%. My plan is to continue working on this model over the next few months, and I am looking forward to adding pitch-by-pitch attack angle and contact/intercept point features to this model once the data becomes publicly available.
This model essentially states that hitters with higher bat speeds have more agency to swing at pitches within the strike zone, while hitters with lower bat speeds must place a strong focus on swinging at pitches they can produce quality contact on to generate a positive run value, which I believe makes intuitive sense. Given these findings, it appears to me that the best approach for measuring swing quality moving forward would be to utilize pitch location and count state for takes, while utilizing pitch location, count state, and bat speed/swing quality for swings.
Concluding Thoughts:
Displaying an ability to make good swing decisions is a very important attribute for a Major League Baseball player, as swings typically result in negative run value for the hitter, underscoring the importance of swinging at pitches the hitter knows they can generate offensive production against. The ability to make good swing decisions is typically thought of as a skill that a player develops in their formative years and is generally regarded as “innate”. This results in quite a paradox, as youth-level baseball is incentivized to have players swing the bat as much as possible (in the interest of both pace of play and generating action to keep children interested in the sport), which can lead to bad swing decision making at the prep level, becoming “concrete” if/when the player becomes a professional.
I believe that there is a competitive advantage to be had if a Major League organization can identify a way to improve a hitter’s swing decisions, even if they can just improve the hitter’s decision grade by 2-5%. I wonder if access to more advanced pitching machines such as a Trajekt could help train hitters to make better swing decisions (especially at the Minor League level), or maybe a team of neuroscientists could determine how hitters could get into the “correct” state of mind to make split-second decisions before entering the batter’s box (although, maybe I’m wading into science-fiction territory now). I am not a hitting coach, so I can’t predict how hitters will react to these types of drills, however, from this chair, I do believe that these could be useful tools to utilize to improve a hitter’s swing decision ability.
In conclusion, effectively evaluating swing decisions is critical to accurately evaluating a hitter’s true offensive potential. Advanced models that incorporate count state, precise pitch locations, and potentially swing quality, provide organizations and analysts with nuanced tools capable of significantly enhancing our understanding of offensive performance. As public bat tracking technology advances further, incorporating new variables like bat speed and attack angle into swing decision evaluation promises even deeper insights into the science of hitting.
Thanks for reading!
Follow @MLBDailyStats_ on X and Adam Salorio on Substack for more in-depth MLB analysis. Photo credits to Gregory Fisher.