


Exploratory Data Analysis into Swing+ and Bat Tracking Data
Utilizing bat speed, collision efficiency, and swing decisions to evaluate offensive production.

 to miss Mariners series | Reuters")
Since I first became involved with Major League Baseball analysis in 2021, I have consistently noticed that analytics and advanced metrics have been more developed for analyzing pitchers than hitters. Over the past couple of seasons, pitching analysis has benefited from the use of both predictive and descriptive metrics on the public side, with metrics such as Stuff+ providing analysts with insights into how pitchers should perform without taking into consideration the outcome of a given pitch. While metrics such as barrel rate, hard hit rate, and best speed are excellent metrics for analyzing batted ball quality, hitting analysis has largely been limited to analyzing what happens after the ball has been put in play, with no analysis of what occurs in the swing before contact.
Since last year, I have used Driveline Baseball’s “Big 3” (bat speed, collision efficiency, and swing decisions) as my foundation for evaluating and projecting offensive performance. I believe that this method of evaluating hitters makes intuitive sense as it encompasses three components that are needed to achieve the ideal offensive result, hitting the ball hard in the air. As Dan Aucoin once said, “The Big 3 was created as a means of quantifying a player’s ability to damage on balls in play, put the barrel on the ball, and swing at the right pitches. Theoretically, if you can quantify these three elements of batting with some precision, you can do a reasonable job of measuring a player’s talent level at the plate.”
Until this season, however, analysis utilizing this method had to be conducted through proxy metrics on the public side (such as hard hit rate in place of bat speed and swinging strike rate in place of smash factor/collision efficiency) due to the limited availability of Major League bat tracking data. With bat tracking data now publicly available since May 2024, I decided to conduct some exploratory data analysis utilizing average bat speed, squared up rate (per swing), and my swing decision model, SOTO, to identify how these metrics affect offensive production and provide insight into how I might construct a “Swing+” model in the future.
Analysis:
Before proceeding to the analysis, I believe it is appropriate to discuss how the “Big 3” metrics mentioned above are calculated. Average bat speed is defined as the average of the top 90% of each player’s swings (therefore removing check swings and bunts). A “squared up” baseball is a batted ball that obtains at least 80% of its attainable exit velocity, which is only obtainable on the sweet spot of the bat. Squared up rate is calculated as the number of batted balls that are “squared up” divided by the number of swings, serving as an effective measure for both contact ability and collision efficiency. My swing decision model, SOTO, evaluates a hitter’s swing decisions by primarily taking into account the location of the pitch and whether or not the pitch was located in the hitter’s “nitro zone”, which is defined as the area in which each hitter produces their Top 5% hardest contact.
Unless otherwise noted, the following analysis was conducted among players with at least 250 plate appearances during the 2024 Major League Baseball season. Onto the analysis!
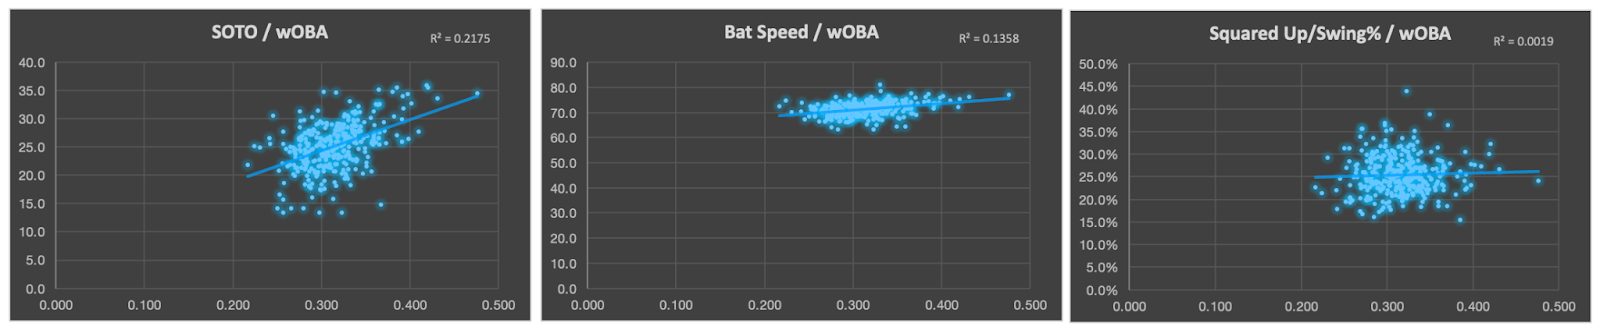
The first step in this exploratory data analysis was to evaluate each of the “Big 3” metrics relationship with wOBA, the total measure of offensive production. My swing decision model, SOTO, can explain ~22% of the variance in a hitter’s wOBA, which is impressive in my opinion given that the model only takes into account whether or not a hitter swung at a given pitch. Each player’s average bat speed explains ~14% of the variance in a hitter’s wOBA, while squared up rate explains ~0.2% of the variance in a hitter’s wOBA.
I was initially surprised to observe that squared up rate had such an insignificant relationship with wOBA when analyzed in isolation, as a hitter’s ability to produce ideal collision efficiencies has frequently been described as a good indicator of a hitter’s bat-to-ball skill, which would indicate an effect on offensive production. Upon conducting further research, I have concluded that this is likely an example of Berkson’s paradox, as there is likely a minimum threshold of collision efficiency that a hitter needs to be able to produce in order to reach the Major League level. In addition, hitters who produce top-end bat speeds do not need to be reliant on plus bat-to-ball skills to generate offensive production, likely skewing the distribution as well. While squared-up rate does not appear to have the ability to explain the variance of a hitter’s wOBA in isolation, it is more powerful in explaining the variance in a hitter’s wOBA when analyzed in concert with bat speed and swing decisions.
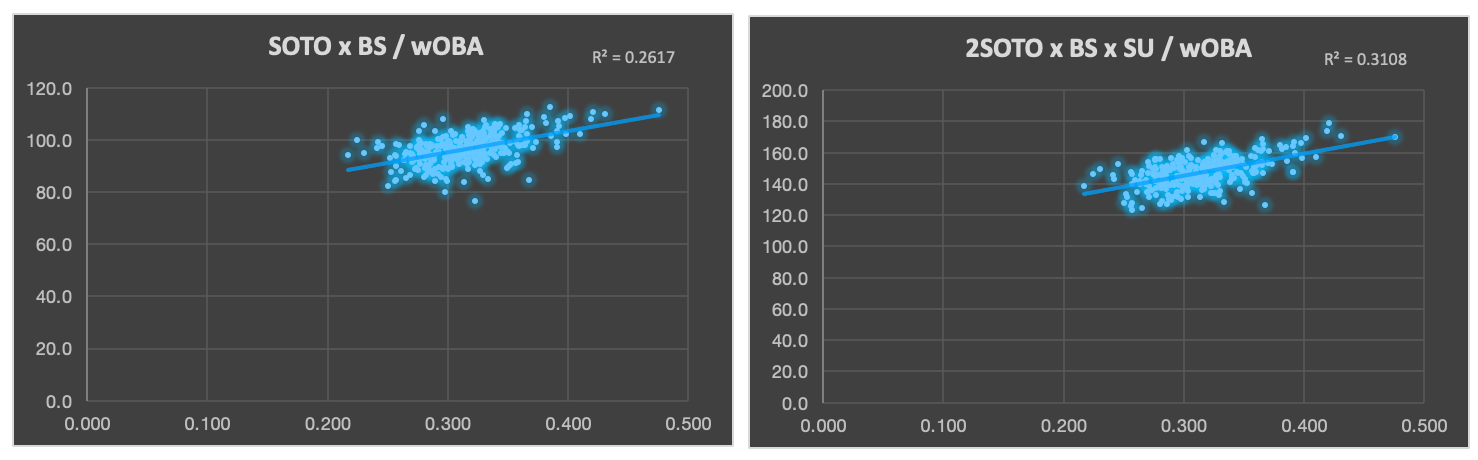
To better evaluate how these variables interact with each other to describe a hitter’s wOBA, I decided to create two experimental statistics. The two statistics I created were the sum of a player’s SOTO and average bat speed (SOTO x BS) and the sum of a player’s SOTO multiplied by 2, average bat speed, and squared up per swing rate (2SOTO x BS x SU). These statistics are not mathematically rigorous at all, as they utilize completely subjective weights, however, they provide valuable insight into how these three variables can work together to explain a hitter’s wOBA. Both statistics have a higher R-squared with wOBA than SOTO, average bat speed, or squared up rate in isolation, which indicates that there is some signal that a model can be constructed to describe and/or predict offensive production utilizing these three variables. Given these findings, I decided to take a more scientific approach, constructing a multiple linear regression utilizing SOTO, average bat speed, and squared-up rate to describe each player’s wOBA during the 2024 Major League Baseball season.
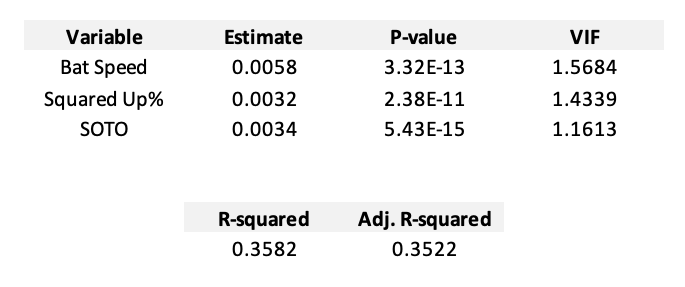
As shown by the tables above, a linear regression utilizing average bat speed, squared up rate, and SOTO is able to explain ~36% of a player’s variance in wOBA during the 2024 Major League Baseball season. Each variable is statistically significant, as evident by their low p-values, and there is little multicollinearity present in the regression, as evident by the low VIF present amongst the three variables.
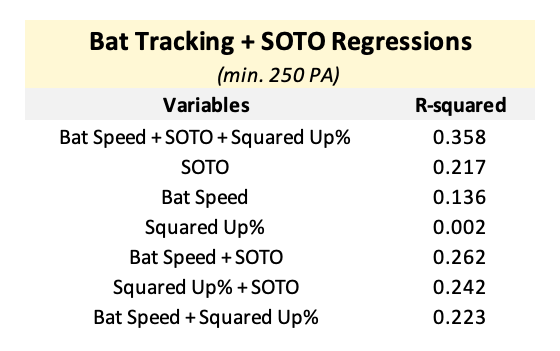
As shown by the table above, utilizing all three of these variables in linear regression is much more effective at explaining the variance in a player’s wOBA than any given combination of these three metrics, or any of these metrics in isolation, as measured by R-squared. These relationships further illustrate the importance of analyzing bat speed, squared up rate, and SOTO together when it comes to evaluating a player’s offensive production, as opposed to analyzing these metrics in isolation. For instance, a player might have elite bat speed but without good swing decisions, they may struggle to translate that raw power into consistent in-game production. Similarly, plus swing decisions alone won’t maximize offensive output without sufficient bat speed or collision efficiency. The results of this analysis suggest that these metrics work synergistically rather than independently, which explains why analyzing them in combination can provide a more comprehensive insight into how a player generates their offensive production.
Concluding Thoughts:
While this regression is able to describe what happened during the 2024 season, given that bat tracking metrics have only been publicly available for one season, it is impossible to evaluate the predictive power of such an analysis. Despite this limitation, there are notable implications from this analysis that provide valuable insight into how bat tracking metrics can be utilized in the future.
One implication of this analysis is that it provides some insight into which variables to utilize when constructing a “Swing+” metric in the future. Given the results of this analysis, it appears to me that the best way to proceed would be to utilize the bat speed and the collision efficiency of a given swing, as well as variable indicating whether the hitter made a “good” or “bad” swing decision as features in a model to predict batter run values, similar to a Stuff+ model. Then, the predictions made by this model can be used to evaluate how well each hitter’s swing translates to offensive production and hopefully can provide predictive insights into how a hitter can be expected to perform moving forward. Per the results of this analysis, utilizing these three metrics as features in such a model appears to be a good starting point.
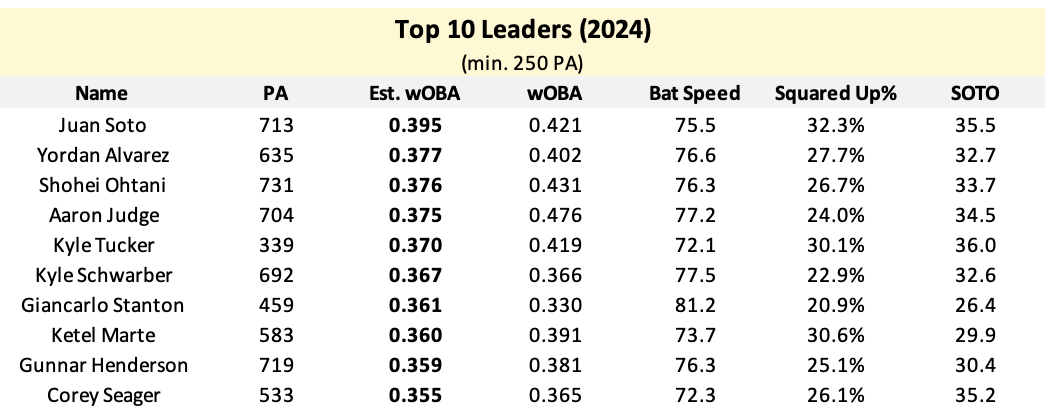
Another implication of this analysis is that it helps to contextualize how bat speed can be used to evaluate offensive performance in concert with collision efficiency and swing decisions. As said by Noah Thurm, “A hitter’s bat speed will set his ceiling and his floor. His [collision efficiency] and swing decisions will ultimately determine where he lives between the two.” A player who displays high bat speed can generate a low collision efficiency and still be a very productive hitter, such as Giancarlo Stanton, while a player who displays a lower bat speed can be a very productive hitter with plus collision efficiency and swing decisions, such as Kyle Tucker and Corey Seager. Combining plus bat speed, collision efficiency, and swing decisions results in Juan Soto, the best hitter in all of Major League Baseball according to Est. wOBA.
I am certain that there will be more impactful public findings as it pertains to Major League bat tracking data in the coming months and years, especially when data such as contact point and attack angle become available. I am particularly interested in the release of contact point, as I believe it could provide insight into which players with above-average collision efficiency and swing decisions and below-average bat speed can tap into more in-game power by increasing their contact point to pull the ball in the air more frequently. Attack angle data could allow analysts to identify which players have inefficient swing paths in specific areas of the zone, providing insight into how a player can improve their contact efficiency and in turn increase their overall level of offensive production. As bat tracking data becomes more publicly available, we are at the beginning of a new era in hitting analysis with further insight into what happens throughout a hitter’s swing, and in the coming years, analysts will have a better understanding of how to evaluate offensive performance through the framework of the Big 3: bat speed, collision efficiency, and swing decisions.
Thanks for reading!
Follow @MLBDailyStats_ on X and Adam Salorio on Substack for more in-depth MLB analysis. Photo credits to USA Today.
Estimated wOBA Leaderboard: https://docs.google.com/spreadsheets/d/1whvnLBZli4QYoqJ7qmdq_WCu_mruGS8udyLGz_TzGhE/edit?usp=sharing