


Since its unveiling this past May, Statcast’s bat tracking data is poised to provide analysts with more tools to effectively evaluate offensive performance, with tools such as bat speed, squared-up rate, and swing length, allowing for analysts to evaluate each player’s offensive potential based on all swings taken rather than just swings that result in contact. Over the past year, I have written numerous articles such as Examining the Future of Hitting and Exploratory Data Analysis into Swing+ and Bat Tracking Metrics in which I have attempted to hypothesize bat tracking data’s future role in evaluating offensive performance in the public sphere and, in my opinion, one effective potential utilization of bat tracking data will be to not only evaluate a player’s production in a given season but to predict a player’s production in the future, similar to how pitch quality models (such as aStuff+) are effective at predicting the future production of Major League pitchers.
To this end, I refamiliarized myself with two articles, How Important Is Bat Speed for MLB Hitters? by J.J. Cooper of Baseball America and A Way-Too-Early Look at the Importance of Bat Speed by Jordan Rosenblum of RotoGraphs, which I believe are particularly insightful in gathering early insight regarding the predictive abilities of average bat speed. Cooper’s article includes average bat speed data for each player with at least 70 plate appearances during the 2023 (!) season, while Rosenblum’s article uses this 2023 bat speed data to make early findings (published May 20, 2024) regarding average bat speed’s ability to predict future wOBAcon. With the 2024 Major League Baseball season completed and a full season of bat tracking data publically available, I have decided to expand upon Rosenblum’s research and analyze the correlations between 2023 average bat speed and 2024 wOBAcon.
Data:
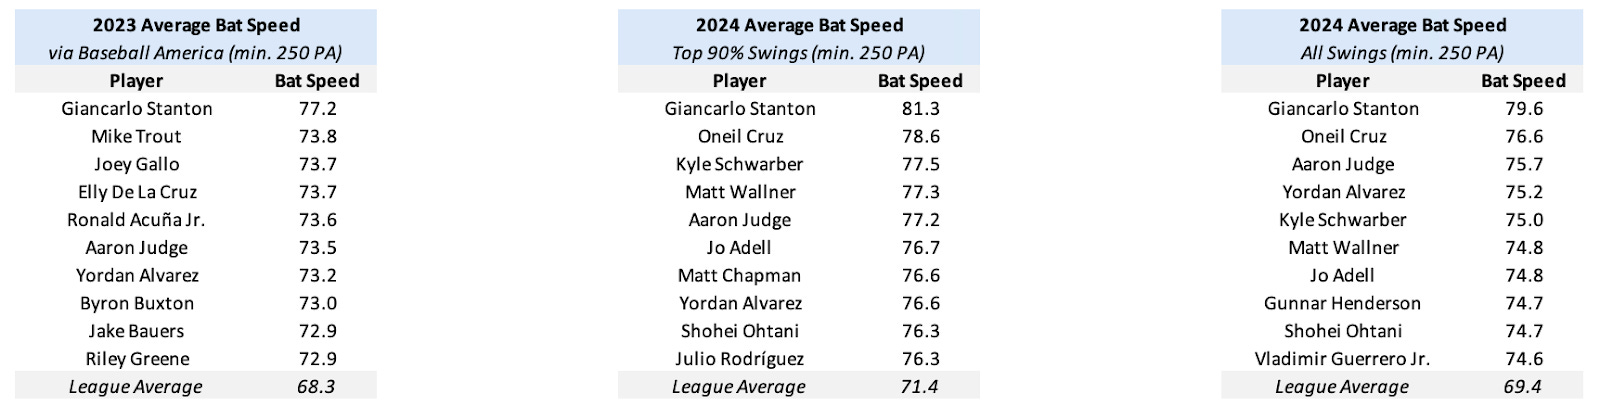
Before proceeding, it is important to clarify a few discrepancies which may arise in the analysis. Upon initial examination, I noticed that the average bat speeds reported for 2023 were lower than those listed on Baseball Savant’s 2024 Bat Tracking leaderboard. Specifically, the average bat speed was 68.3 MPH for 2023 compared to 71.4 MPH for 2024. The discrepancy arises because Statcast calculates a player’s average bat speed based on the fastest 90% of their swings, effectively excluding the slowest 10% to remove non-competitive swings. In contrast, the 2023 data from Baseball America includes all swings without any exclusions. To ensure an accurate comparison, I recalculated the 2024 average bat speeds by including all swings, not just the fastest 90%. This adjustment aligns the 2024 data with the 2023 dataset from Baseball America, reducing the average bat speed discrepancy between seasons to approximately 1 MPH. The remaining 1 MPH difference could be attributed to natural year-to-year variance or adjustments in Statcast’s measurement techniques, such as changes in how bat speed is measured along the swing path.
Correlations:
To evaluate the predictive ability of average bat speed, I analyzed the correlation coefficients between each player’s 2023 average bat speed and their 2024 wOBAcon. For comparison, I also analyzed the correlation coefficients between various 2023 batted ball metrics (such as barrel rate, xwOBAcon, best speed (EV50), and hard hit rate) and 2024 wOBAcon. In addition, I calculated how well each metric predicts itself year-to-year. The dataset for this analysis consisted of Major League Baseball hitters with at least 100 plate appearances in each of the past two seasons.
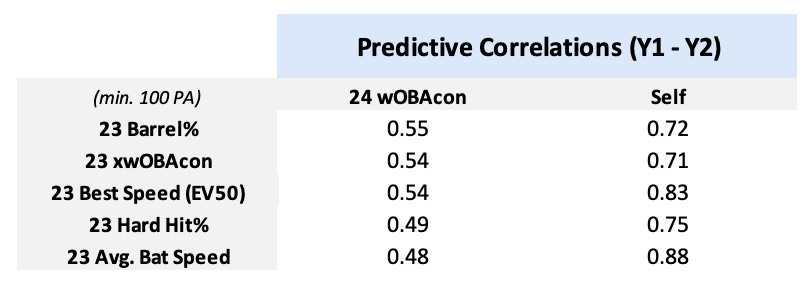
As shown by the table above, barrel rate has the highest year-to-year correlation with wOBAcon (r = 0.55), followed by xwOBAcon, best speed (EV50), and hard hit rate. Average bat speed ranks as the metric with the lowest year-to-year correlation with wOBAcon (r = 0.48), however, this relationship is similar to hard hit rate (r = 0.49). This is impressive, considering that average bat speed is calculated from all swings, regardless of whether they result in contact, whereas the other metrics are solely based on batted balls.
Does this mean that making contact and having good bat-to-ball skills doesn’t matter? Of course not. However, this relationship suggests that average bat speed is a strong indicator of a player’s offensive potential, and could be considered a better measure than certain batted ball metrics (such as hard hit rate) as it may be less influenced by the statistical noise inherent in some batted ball data (e.g., treating all batted balls hit 95+ MPH the same, regardless of their specific exit velocity). Given this strong relationship, I hypothesize that calculating each hitter’s average bat speed on swings that result in contact would likely have a stronger year-to-year correlation with wOBAcon than hard hit rate. This metric, however, is not able to be calculated from Baseball America’s 2023 bat speed data.
As shown by the correlation table, average bat speed is able to predict itself better year-to-year than any of the other aforementioned batted ball metrics (assuming we have properly adjusted the 2024 bat speed data to align with the 2023 bat speed data). This year-to-year stickiness provides more confidence in average bat speed’s ability to predict future offensive performance and is another reason why bat speed data can be a valuable tool to utilize when evaluating offensive players.
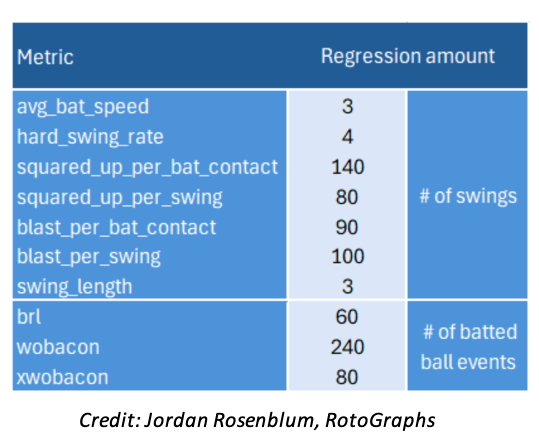
Perhaps the most valuable feature of bat speed data is its ability to stabilize in small samples. As shown by the table above created by Jordan Rosenblum of RotoGraphs, most of the signal in a player’s average bat speed can be determined after just 3 swings, compared to the 60 batted ball events needed for barrel rate and 240 batted ball events needed for wOBAcon. With such a small sample necessary for the statistic to stabilize, average bat speed can be a good measure to use to predict how much offensive production a hitter will be able to produce in the future with a small sample size, similar to how Stuff+ is able to provide predictive insight about pitchers in small sample sizes.
Notable Year-to-Year Bat Speed Changes:
Another use of comparing year-to-year bat speed data is to analyze which players’ increase or decrease in year-to-year offensive production can be attributed to an improvement or decline in average bat speed.
Similar to the correlation analysis, it should be noted that there may be some discrepancies in the calculation of bat speed between seasons, and given the ~1 MPH difference in average bat speed from 2023 and 2024, it is perhaps a good rule of thumb to add 1 MPH to the 2023 average bat speed values displayed below.
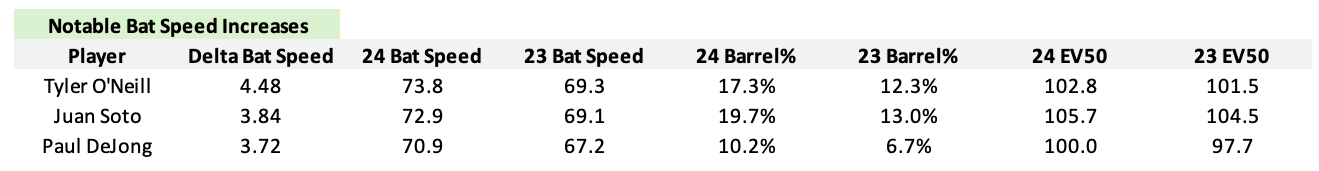
As shown by the table above, Tyler O’Neill, Juan Soto, and Paul DeJong experienced some of the largest year-to-year bat speed increases in 2024. In addition to increasing his pulled fly ball rate this past season, Tyler O’Neill added ~4 MPH of bat speed, resulting in a 1.3 MPH increase in his EV50 and a 5.0% increase in barrel rate which contributed to his bounce-back 131 wRC+ in 2024.
Already one of the best hitters in Major League Baseball entering the season, Juan Soto added ~3 MPH of bat speed, resulting in increases in his EV50 and Barrel% which contributed to an outstanding 180 wRC+ in 2024, the best full season of his career.
After spending the 2023 season with three different teams, Paul DeJong added ~3 MPH of bat speed in 2024, resulting in a 10.2% barrel rate and 24 home runs over 482 plate appearances this past season. While DeJong’s aggressive approach at the plate and troubling bat-to-ball metrics (19.0% swinging strike rate) indicate that he will likely experience a sharp aging-related decline in the near future, this increase in bat speed allowed him to generate at least one more productive season offensively in 2024.
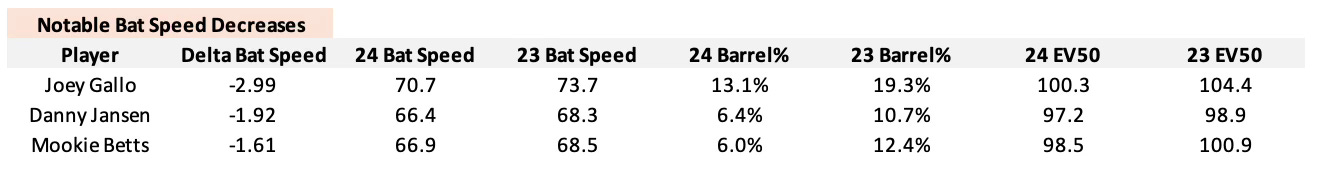
As shown by the table above, Joey Gallo, Danny Jansen, and Mookie Betts experienced some of the largest year-to-year bat speed decreases in 2024. Joey Gallo’s ~3 MPH decline in bat speed led to a 4.1 MPH decline in EV50 and a 6.2% decline in barrel rate from 2023. As explained by Tom Tango in April, a player’s average bat speed typically begins a sharp decline around age 31. Entering his age 31 season, this decline in bat speed displayed by Gallo this season indicates that he is likely on the wrong side of the aging curve. Danny Jansen experienced a ~2 MPH decline in bat speed this season, which is backed up by the 1.7 MPH decrease in EV50 and 4.3% decrease in barrel rate he experienced in 2024.
Mookie Betts also experienced a notable decline in bat speed this season, with his average bat speed decreasing by ~2 MPH from 2023. Some of this decline can be explained by Betts’s fractured hand he experienced in June, however, Betts was already experiencing a decline in bat speed prior to the injury (among all swings, 67.3 MPH average bat speed before the injury, 66.3 MPH average bat speed after the injury). Betts generates most of his in-game power by pulling the ball in the air, leveraging his plus bat-to-ball skills, which result in him being less reliant on bat speed to generate power production. While this decline in bat speed might be less important for Betts than a player with below-average bat-to-ball skills (such as Joey Gallo), this development is notable and could portend a decrease in Betts’s batted ball quality throughout his 30s.
Concluding Thoughts:
The introduction of bat speed data to the public sphere of baseball analysis has already paved the way for valuable new insights into evaluating offensive players, and the continued rollout of new metrics such as contact point and attack angle will only improve the public’s understanding of how offensive production is created. While batted ball metrics such as barrel rate and best speed (EV50) are more effective at predicting year-to-year offensive production, average bat speed’s similar predictive performance and quick point of stabilization allows analysts to predict future offensive performance better in small sample sizes than was previously available. Comparing year-to-year bat speed data also provides analysts with more context in explaining why certain players experienced an increase or decrease in offensive production in a given year and can be used to convince hitters with untapped power potential that undergoing bat speed training in the off-season can be an effective training method to help them reach their offensive ceiling. In conclusion, the integration of bat speed data into the evaluation process of Major League Baseball hitters will enhance analyst’s abilities to predict future performance, guide player development, and deepen our understanding of the factors that contribute to generating offensive production.
Thanks for reading!
Follow @MLBDailyStats_ on X and Adam Salorio on Substack for more in-depth MLB analysis. Photo credits to Los Angeles Times.