A couple of weeks ago, Statcast released their long-awaited swing path metrics: attack angle and swing path tilt, which, when combined with other new metrics such as bat speed, collision efficiency, and contact/intercept point, provide optimism that a new era of analyzing offensive players on the public side is upon us. While existing batted ball metrics such as exit velocity and launch angle can provide analysts with valuable information regarding how well an offensive player performs upon contact, these new bat tracking metrics uncover the possibility that a more well-rounded analysis of an offensive player’s potential can be conducted, as we now have information regarding each hitter’s process (the swing), as opposed to their results (the batted ball event).
In my opinion, the most intriguing metric released by Statcast in their newest release has been swing path tilt. Swing path tilt measures the angle of the player’s bat path over the 40 milliseconds prior to contact, with a higher angle reflecting a “steeper” swing and a lower angle reflecting a “flatter” swing. The swing path tilt of a given swing can be influenced by the pitch’s location, as pitches up in the zone are likely to generate flatter swings while pitches lower in the zone are likely to generate steeper swings.
Swing path tilt has already been useful in enhancing the analysis of the changes offensive players have made to their offensive approach. In my article on Pitcher List last week, “Spencer Torkelson is Lifting Off”, I discussed how Torkelson altered his swing path over the offseason, with the increased swing path tilt likely contributing to his improved ability to hit the ball in the air in 2025. Preliminary analysis into swing path tilt appears to indicate that swings with “flatter” tilts result in less swing-and-miss and lesser batted ball quality, while swings with “steeper” tilts produce better batted ball outcomes at the expense of more swing-and-miss, an intuitive explanation that would be confirmed by many hitting coaches. This article will take an exploratory look at swing path tilt data from the 2024 season, establish its predictive ability compared to other bat tracking metrics, and attempt to identify hitters who have “good swings” according to these new metrics.
Swing Path Tilt + Bat Speed by Zone:
As mentioned earlier, the swing path tilt of a given swing can be influenced by the pitch’s location, with pitches up in the zone likely to generate flatter swings, while pitches low in the zone are likely to generate steeper swings. This occurs because hitters aim to get “on plane” with the incoming pitch, and since pitches at the bottom of the zone arrive at a steeper angle, they require steeper swings to match that trajectory.
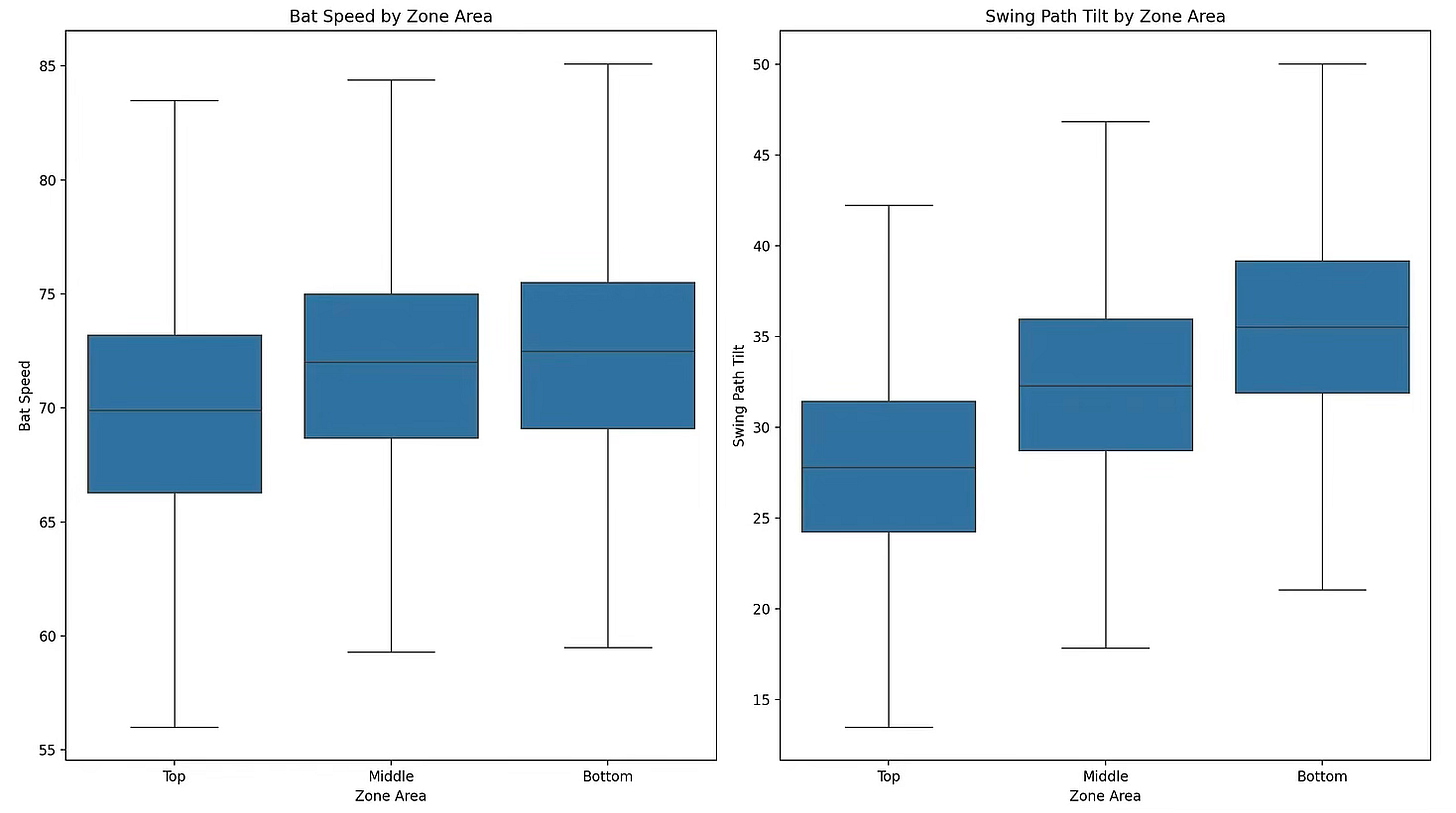
To visualize this effect, I divided the strike zone into three sections: Top, Middle, and Bottom, and created two sets of box and whisker plots to display the distribution of bat speed and swing path tilt values in each zone area, using data from each swing taken during the 2024 Major League Baseball season. Pitches located outside of the strike zone were excluded from this analysis. As shown by the plot on the left, the average bat speed is slower on pitches towards the Top of the strike zone, while the distribution on pitches located in the Middle and Bottom are roughly the same (Bottom swings are slightly faster). Statcast measures bat speed as the velocity of the sweet spot of the bat at the estimated point of contact. Longer swings have more time to accelerate, generating more bat speed, and since pitches at the top of the zone require a shorter swing length for batters to “cover” this area, these pitches result in a slower bat speed.
As shown by the plot on the right, there is a clear relationship between zone area and the swing path tilt of a given swing. Pitches towards the top of the zone generate flatter swings, with a ~28-degree average swing path tilt, while pitches towards the bottom of the zone generate steeper swings, with a ~36-degree average swing path tilt. These plots display the importance of taking into account pitch location when analyzing the bat speed and swing path tilt of a given swing, as batters make an attempt to get “on-plane” with the incoming angle of a pitch, and it is imperative that any attempt to quantify swing quality should take these effects in account.
Predictive Ability:
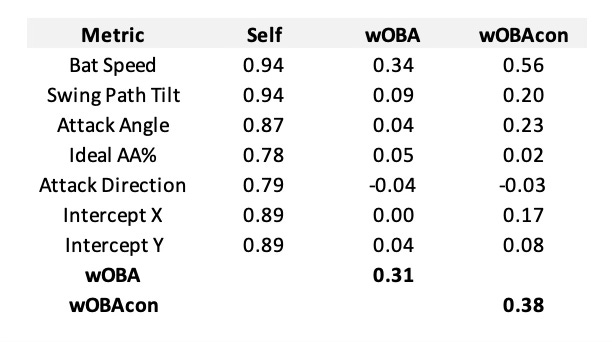
Two factors that make bat speed a valuable metric to utilize when evaluating offensive players are its ability to become reliable quickly, and its ability to predict itself and future offensive production. To evaluate swing path tilt’s predictive ability, I calculated the year-to-year correlations of the new bat tracking metrics to themselves, as well as to wOBA and wOBAcon, among offensive players with at least 500 pitches faced in the second half of the 2023 season and the 2024 season (where bat tracking data is available).
As shown by the table above, bat speed reigns supreme as the most predictive bat tracking metric, displaying superior performance in each category, and being more predictive of future wOBA and wOBAcon than the metrics themselves. As it pertains to year-to-year stability, swing path tilt displays the same level of “stickiness” as bat speed, indicating that the metric exhibits consistency over time, and can be reliably used as a predictive measure of offensive production.
Compared to swing path tilt, attack angle generally displays weaker predictive ability, with less year-to-year stability and ability to predict future offensive production by measure of wOBA. Interestingly, attack angle is more predictive of future wOBAcon than swing path tilt. Perhaps analyzing the correlations between swing path tilt on contact and attack angle on contact with wOBAcon would provide more insight into this relationship, however, that will be a topic for an attack angle-based article in the future.Attack angle measures the vertical direction of a player’s bat at the moment of contact (or estimated point of contact), and is heavily influenced by a hitter’s contact/intercept point, as the bat travels more upward throughout a player’s swing. I believe that the heavy influence of timing factors, such as contact/intercept point, contributes to the inferior year-to-year stability of attack angle relative to swing path tilt. Attack angle has perhaps gotten the most attention out of the new swing path metrics, likely due to the fact that the metric’s terminology has already been in the public’s lexicon, however, in my opinion, swing path tilt appears to be a better metric to utilize regarding predictive ability, due to its superior year-to-year stability and ability to predict future wOBA.It is also critical to identify the sample size of swings required for swing path tilt to become reliable for analysis. As mentioned earlier, bat speed is such a valuable metric to utilize when evaluating an offensive player’s performance in small sample sizes because it becomes reliable after only three swings. One of my “north stars” when it comes to analyzing both hitters and pitchers is to utilize metrics that are both predictive and stabilize quickly, and it appears that swing path tilt not only meets this criteria, but is superior compared to the other swing path metrics.
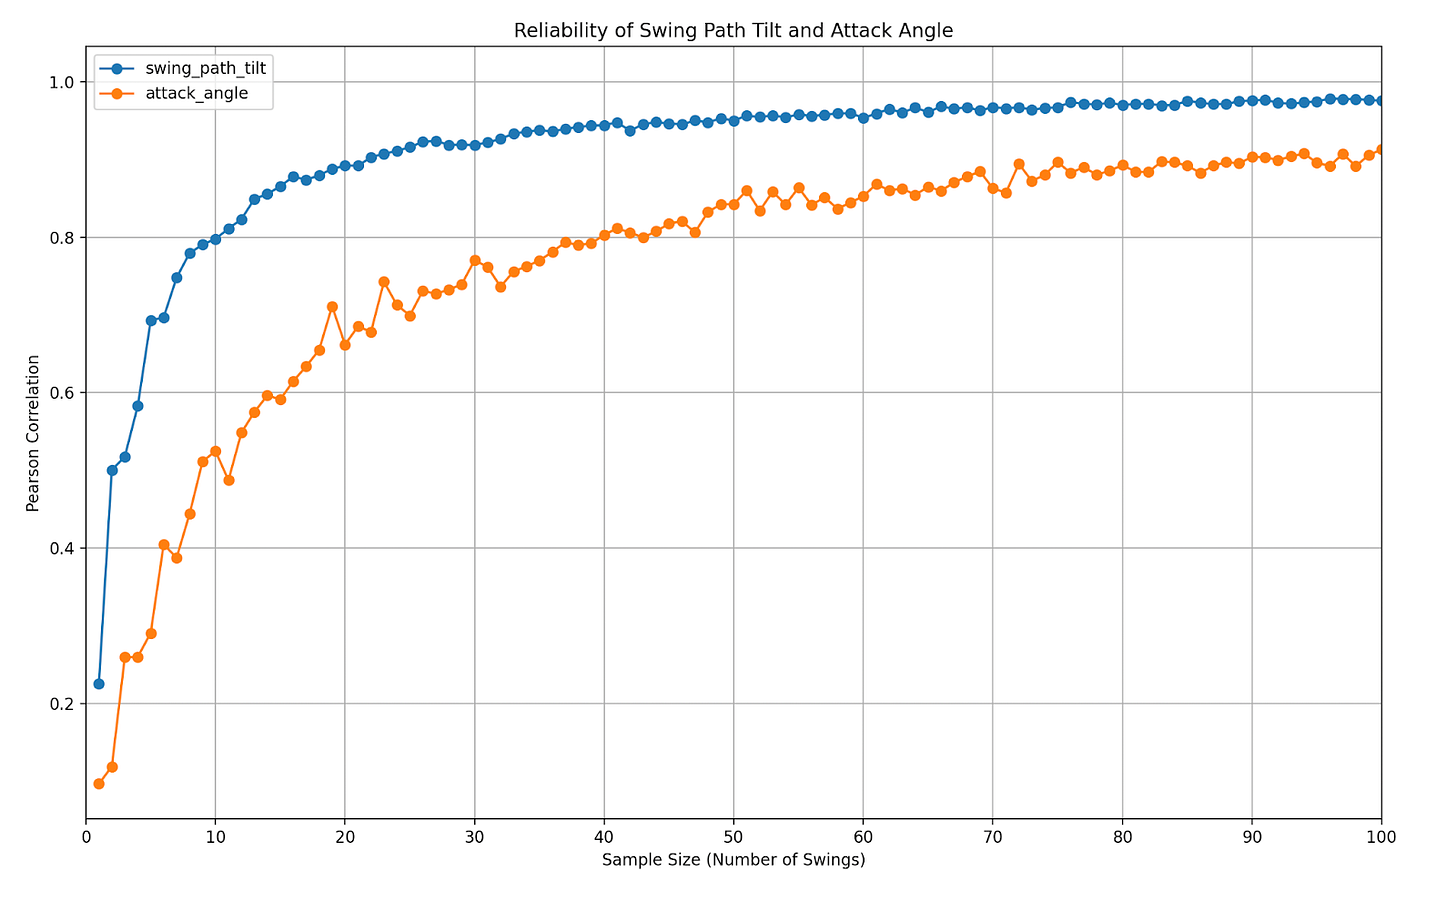
To calculate the reliability point for swing path tilt, I utilized a similar method to how Tom Tango determined the reliability point for average bat speed. As shown by the plot above, swing path tilt becomes reliable very quickly, reaching a 0.80 level of Pearson correlation at just 11 swings. For comparison, attack angle reaches this level of stabilization at 40 swings, still a relatively small sample size, but inferior to the stabilization point of swing path tilt. This small sample size needed for reliability indicates that by utilizing a combination of bat speed and swing path tilt, a large amount of an offensive player’s “true talent” level can be identified with a sample size of less than 20 swings.
These findings do not mean that attack angle should be completely ignored in favor of swing path tilt. As mentioned earlier, attack angle is heavily influenced by a hitter’s contact/intercept point, as the bat travels more upward throughout a player’s swing, and could be a valuable metric to utilize in conjunction with swing path tilt to determine the quality of a hitter’s timing. For example, James Wood possesses a steep swing path tilt of 40 degrees but displays a 9-degree attack angle, indicative of his deep contact point which prevents him from frequently pulling the ball in the air. Conversely, as I discussed in my latest Pitcher List article, Addison Barger has flattened his swing path tilt while increasing his attack angle, potentially discovering a “Goldilocks zone” of improved Barrel% and contact ability. Overall, evaluating swing path tilt in tandem with attack angle offers a more holistic view of a hitter’s bat path and swing quality, helping to uncover whether a player is maximizing their swing path tilt to generate power and/or make consistent contact.
Bucketing:
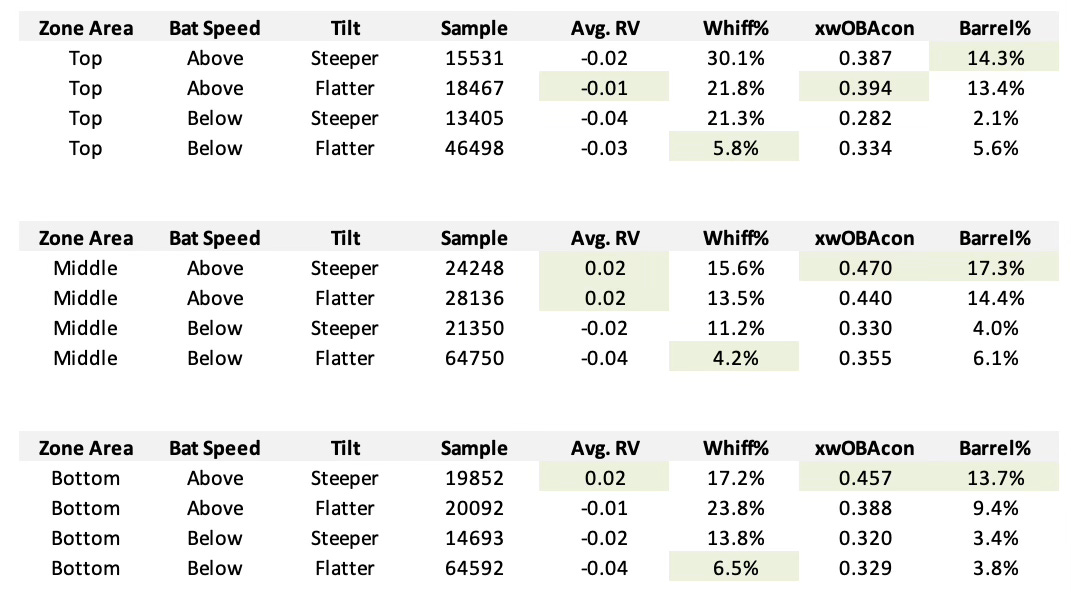
By bucketing swings by bat speed and swing path tilt, we can attempt to identify hitters who have “good” or “bad” swings according to these new metrics. As discussed earlier, the bat speed and swing path tilt of each swing are influenced by the location of the incoming pitch. Therefore, using data from the 2024 Major League Baseball season, I calculated the average bat speed and swing path tilt of pitches in the Top, Middle, and Bottom of the strike zone, and bucketed swings according to whether they exhibited below/above-average bat speed and below/above-average swing path tilt, relative to their zone area average. Pitches located outside of the strike zone were excluded from this analysis.
As shown by the table above, swings possessing above-average bat speed, on average, display better results than swings with below-average bat speed, regardless of swing tilt. Against pitches located at the top of the strike zone, swings with above-average bat speed and flatter-than-average tilt tend to perform better with a -0.1 average run value, 21.8% whiff rate, and .394 xwOBAcon, while fast swings with steeper-than-average tilt generate a higher barrel rate. Against pitches in the middle and at the bottom of the strike zone, fast swings with steeper-than-average tilt reign supreme, with at least a .450 xwOBAcon and double-digit barrel rate in each location of the strike zone. Swings with above-average bat speed and flatter-than-average tilt perform nearly as well against pitches in the middle of the strike zone, however, they experience an increase in swing-and-miss at the bottom of the strike zone. Swings with below-average bat speed and flatter-than-average swing path tilt appear to clearly be the worst bucket of swings, despite being the most common type of swing, with consistent low batted ball quality and run value metrics despite displaying a very low whiff rate across the zone.
The table above removes the zone area grouping, displaying swings bucketed by below/above-average bat speed and below/above-average swing path tilt relative to their zone area (for clarification, the Above/Steeper bucket contains ALL swings that have above-average bat speed and steeper-than-average tilt, relative to the zone area average of the swing). Swings that display above-average bat speed and steeper-than-average tilt display the best results across all pitches, while swings with below-average bat speed and flatter-than-average tilt display the least-favorable results across all pitches, by measure of run value.
Bucketing is not the most scientific approach to data analysis, and it certainly has its flaws, as the buckets are clearly not evenly distributed, however, this analysis does provide a foundational understanding of which type of swings are generally most productive. Swings that are fast and on a steeper plane are, in a vacuum, the best swings to possess (as they are most likely to result in hard-hit contact in the air), while swings that are slow and on a flatter plane are less likely to result in a swing-and-miss, at the expense of overall run production.
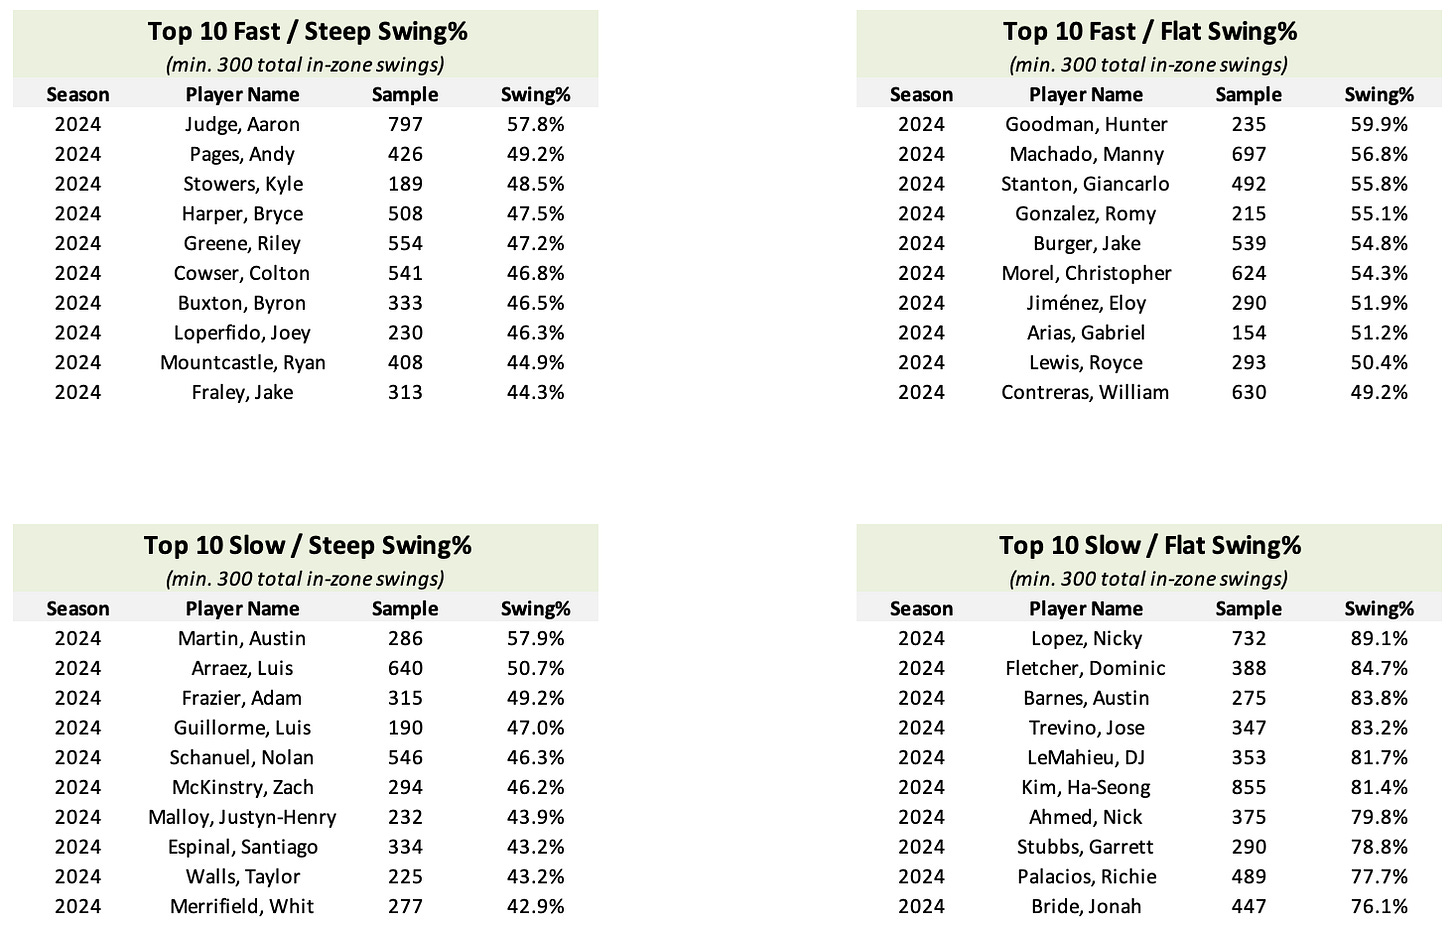
The table above displays the players who most frequently displayed swings in each of the four aforementioned buckets during the 2024 Major League Baseball season, minimum 300 in-zone swings. The Fast/Steep leaderboard is filled with players who demonstrated an ability to hit for power (Aaron Judge, Bryce Harper, Riley Greene), and perhaps this data could’ve been used as a predictive indicator of Kyle Stowers’s hot start to the 2025 season. The Fast/Flat leaderboard contains an intriguing list of players who have also demonstrated an ability to hit for power, and perhaps this explains Eloy Jiménez’s tendency to hit the ball hard into the ground. The Slow/Steep leaderboard contains multiple “bat-to-ball savants” such as Luis Arraez, Adam Frazier, and Luis Guillorme, while the Slow/Flat leaderboard contains a rather uninspiring group of hitters.
Concluding Thoughts:
In my opinion, swing path tilt is the most intriguing new metric in Statcast’s latest release. Swing path tilt is able to stabilize quickly, which when combined with bat speed, provides optimism that the public can understand more about the effectiveness of a hitter’s swing path in a small sample size when combining these two metrics. Swing path tilt is significantly influenced by the vertical location of the incoming pitch, and research indicates that analyzing tilt, relative to the pitch’s location, can affect the contact probability of a given swing. Given its year-to-year stickiness and ability to become reliable quickly, it appears apparent that swing path tilt along with bat speed will be two major features to utilize when constructing a swing quality model in the future.
Statcast’s new swing path and attack angle data are still incredibly fresh and I am still attempting to decipher the best way to utilize this data, however, I am confident that swing path tilt will have a prominent place in the discussion of offensive analysis moving forward. There is a long time between now and the release of a Swing+ metric, but very preliminary results indicate that utilizing these two metrics in combination is more predictively powerful than simply utilizing bat speed in isolation to measure a player’s offensive ceiling (hopefully these results hold up through further testing). The release of bat tracking and swing path metrics by Statcast provides optimism that a new era of analyzing offensive players on the public side is upon us, with tools available that could allow the public to both evaluate offensive player’s swings in a similar manner to how we evaluate pitchers using Stuff+, and further understand the science of hitting.
Thanks for reading!
Follow @MLBDailyStats_ on X and Adam Salorio on Substack for more in-depth MLB analysis. Photo credits to John Froschauer - Imagn Images.


